Ivie IE-45 RT60 - Reverberation Time Analysis User Manual
Page 7
IE-35 & IE-45 RT-60 Manual
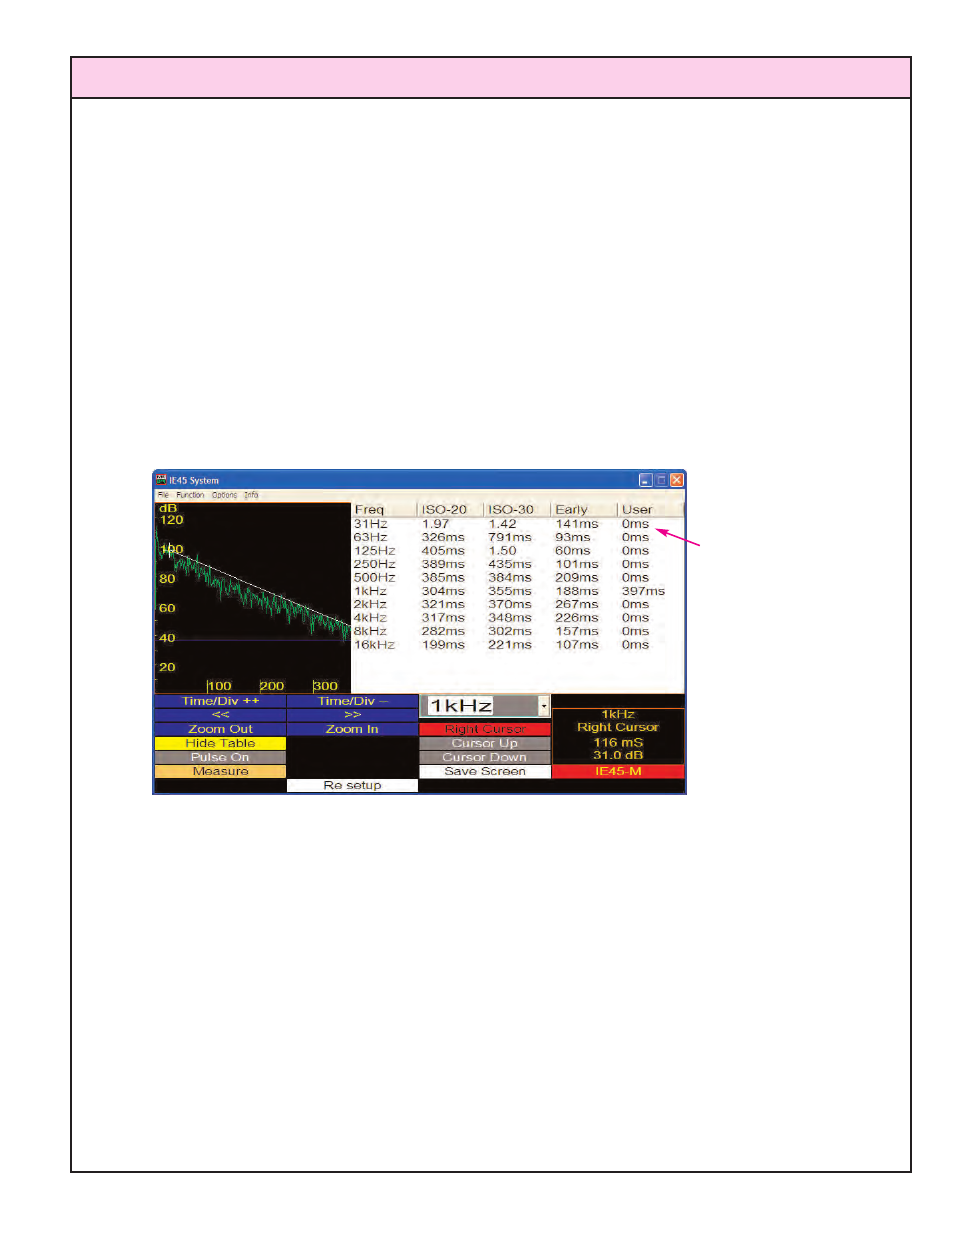
Once the right cursor has been placed, RT60 is automatically calculated for the section of
decay curve selected, and that calculated number (labeled “User”) appears with the Early
Decay, ISO 20 and ISO 30, RT60 calculations displayed. In this manner, “User Defined”
RT60 calculations can be made for any octave or 1/3 octave channel.
Numeric Data Display
While graphic information can be displayed for only one channel at a time, numeric RT60 data
can be displayed for all channels simultaneously. To display the measurement data numeri-
cally, tap the stylus button labeled “Show Table.” A window will pop-up, displaying the
measurement data for all channels (octave, or 1/3 octave, depending on what was
selected before making the measurement). The data is first calculated (this may take a
moment or two, so be patient), then displayed in a spread sheet format, as shown below:
Note: In our example above, notice that the 1 kHz octave band shows a“User” RT60 number
and the other channels do not. The channel with “User” numbers attached to it is the one
where the cursors have actually been physically employed to define a “User” calculation. If
you don’t make a “User” calculation in a channel, one will not print out in the numeric data.
To hide the numeric table, tap the stylus button labeled “Hide Table.”
Storing and Saving RT60 Measurement Data
There are some options when it comes to saving your RT60 measurement data. If you simply
want to print out what you see on the IE-35 or IE-45 display screen (whether decay curve
graphics or the numeric table of measurement data) simply tap the white stylus button labeled
page 7
Note: Numeric
measurement data is
displayed for octave
channels, or 1/3
octave channels,
depending on
whether you
selected octave, or
1/3 octave RT60
measurements.