Rt60 decay curve – Ivie IE-45 RT60 - Reverberation Time Analysis User Manual
Page 3
IE-35 & IE-45 RT-60 Manual
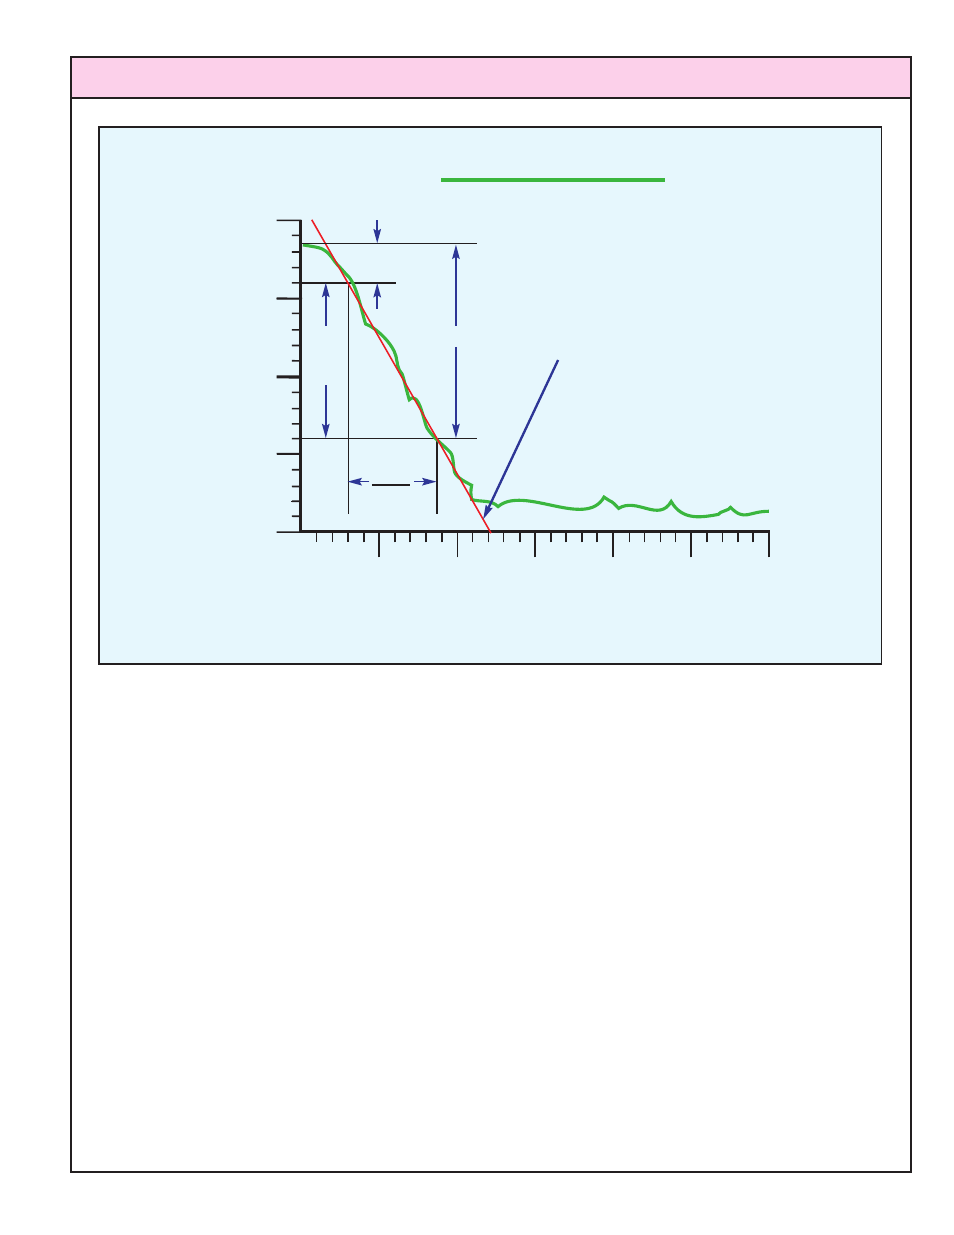
The above plot shows a decay curve and identifies sections of that decay curve. To insure
statistical accuracy in measuring and plotting decay, the IE-35 and IE-45 take samples (of
amplitude in dB) at the rate of 100 samples per second, regardless of the length of the meas-
urement window selected.
Notice that a 20dB section of decay curve has been identified. It begins at -5dB and ends at
-25dB. Since 20dB is one third of 60dB, the decay time over this 20dB window would be 1\3
of the total RT60, as the diagram shows. The international ISO standard requires that RT60
calculations be made based upon this specific section of a decay curve. The IE-35 and IE-45
call RT60 measurements based on this decay curve section “ISO (20).” This standard also
specifies a 30dB decay window, from -5dB to -35dB, which can be used for calculations if
there is sufficient decay available. The IE-35 and IE-45 designates this measurement as “ISO
(30).” Additionally, the first 5dB of decay is often of interest. Calculation of RT60 based on
this section of the decay curve is designated by the IE-35 and IE-45 as “Early Decay.” Both
the IE-35 and IE-45 calculate ISO (20), ISO (30), and Early Decay times for each frequency
band. A numeric printout of RT60 would include numbers for each of these. If there were
insufficient decay to calculate ISO (30), dashes would be printed to indicate insufficient data.
In our example above, a straight, red line has been mathematically fitted over the green decay
page 3
RT60 Decay Curve
-25dB
-5dB (Early
decay)
20dB
(ISO
20)
Mathematically
Derived Slope
RT60
3
Time in Seconds
1.0
2.0
3.0
4.0
5.0
6.0
Decay
in dB
-40dB
-30dB
-20dB
-10dB