Casio fx-9750G Sketch Function User Manual
Page 7
179
uuuuu
To graph an inverse function in the RUN or PRGM Mode
The following is the syntax for graphing an inverse function in these modes.
Inverse
• Use the variable data (VARS) menu to specify the function to be graphed.
• You can only graph the inverse of functions whose graph type is specified as
rectangular coordinate type.
k
k
k
k
k
Plotting Points
When plotting points on a graph, first display the sketch menu and then press
6
(
g
)
1
(PLOT) to display the plot menu.
6
(
g
)
1
(PLOT)
1
(Plot) ........ Plot a point
2
(Pl•On) ..... Plot point at specific coordinates
3
(Pl•Off) ..... Delete point at specific coordinates
4
(Pl•Chg) ... Switch status of point at specific coordinates
uuuuu
To plot points in the STAT, GRAPH, TABLE, RECUR and CONICS
Modes
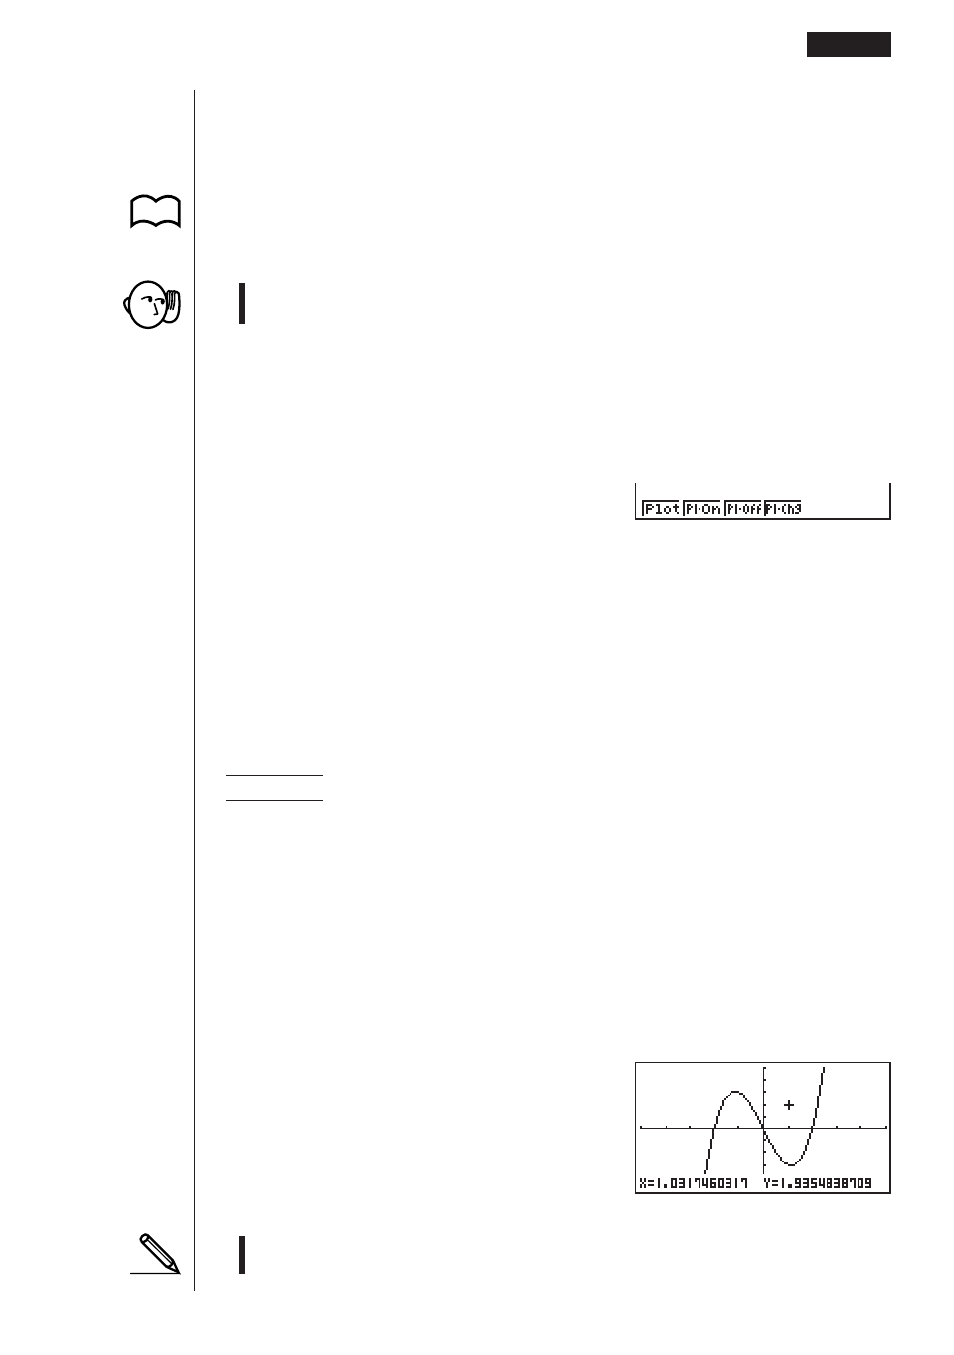
Example
To plot a point on the graph of
y
=
x
(
x
+ 2)(
x
– 2)
1. After graphing the function, display the sketch menu and perform the following
operation to cause the pointer to appear on the graph screen.
!4
(Sketch)
6
(
g
)
1
(PLOT)
1
(Plot)
2. Use the cursor keys (
f
,
c
,
d
,
e
) to move the pointer the locations of the
points you want to plot and press
w
to plot.
• You can plot as many points as you want.
e
~
ef
~
f
w
• The current
x
- and
y
-coordinate values are assigned respectively to variables X
and Y.
Graphing with the Sketch Function
10 - 2
1 2 3 4
5 6
P.33