Measurement Computing USB-5100 Series User Manual
Page 6
USB-5100 Series Software: Getting Started
Reading out the Logger
6
Reading out the Logger
To retrieve data recorded by a logger, read out the logger. When reading out, data is copied from the logger to a
computer. You can save the data to a datafile and view the plot.
During readout, the logger continues to record data unless the logger is stopped or the memory is full.
Perform the following steps to read out the logger:
1. Click the
Readout device
toolbar icon.
A warning message appears indicating the logger is currently logging.
2. Click
Don't Stop
to continue logging, or
Stop
to end logging before reading out.
3. After reading out the logger, you are prompted to save the data file. Type a name and select a location for
the file and click
Save
.
The
Plot Setup
window opens, which is described in the next section.
Plotting and Analyzing Data
After you read out a logger and save the datafile, or any time you open an existing file, the
Plot Setup
window
opens. Even if you only intend to export the data to another format, you must plot the data first.
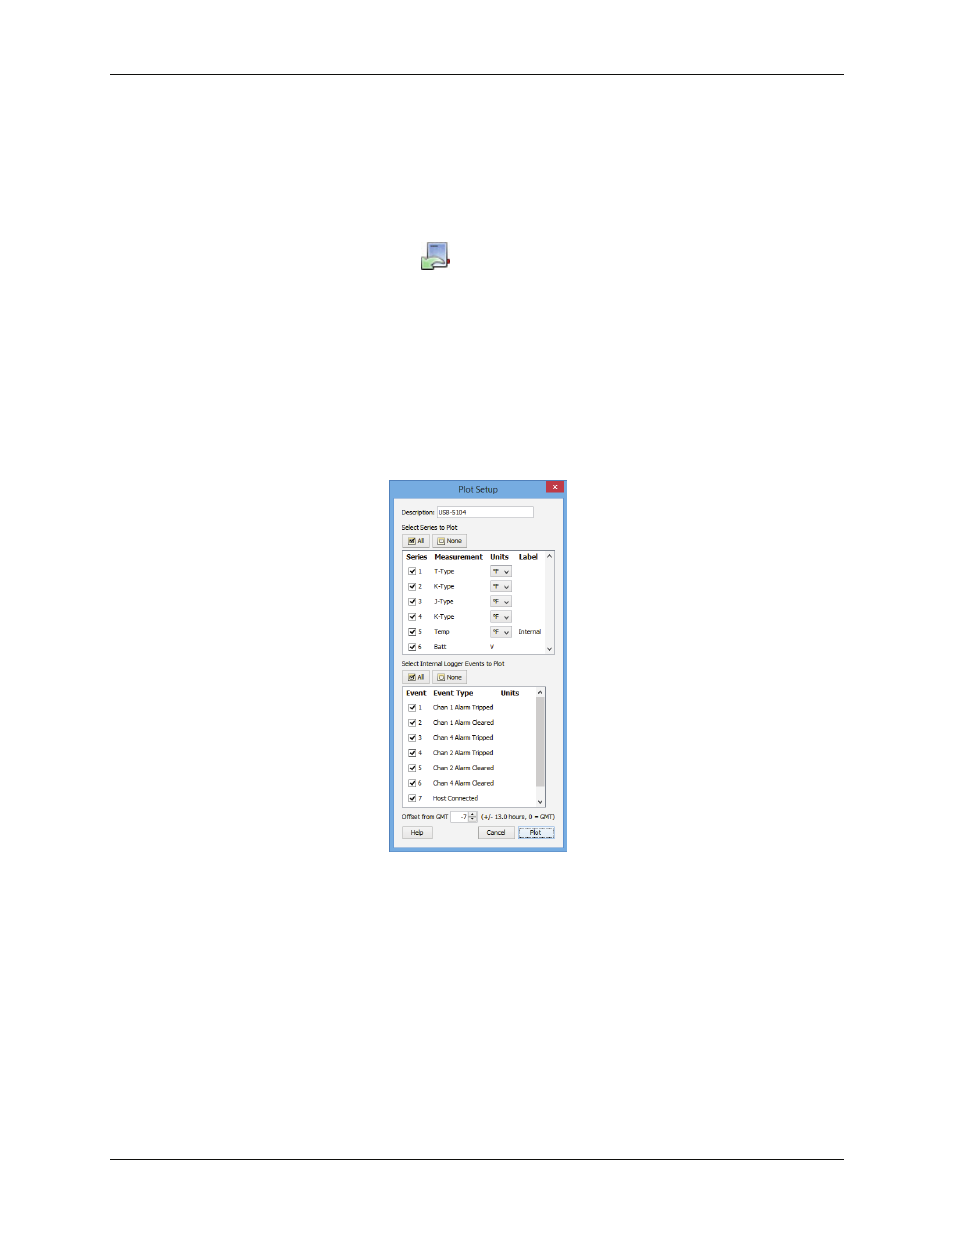
The
Plot Setup
window contains the following information:
Description
: This field shows the description you entered at launch time. Keep this description or enter a
new one. The description is used for the title of the plot.
Select Series to Plot
: Select the checkbox for each series that you want to plot on the graph. Use the
All
and
None
buttons to select or deselect all series at one time.
Select Internal Logger Events to Plot
: Select the checkbox for each event that you want to plot on the
graph, if applicable. Use the
All
and
None
buttons to select or deselect all events at one time.
Offset from GMT
: This field shows the offset from Greenwich Mean Time (GMT), also known as UTC,
used at launch. Keep the offset shown or change it to a different value.
Plot Button
: Click
Plot
to display the selected sensor data on a graph.
After you click the
Plot
button in the Plot Setup window, the data appears in a graph along with other
information described below.