Measurement Computing USB-5100 Series User Manual
Page 5
USB-5100 Series Software: Getting Started
Checking Logger Status
5
Click the
Alarms
button to set an alarm to trip when a sensor reading rises above or falls below a specified
value. Click the
Filters
button to create a filtered series for any of the channels you configured. The filtered
series is automatically calculated when data is read out and plotted.
Deployment
: Use this pane to set the logging interval, the logging mode (Normal, Burst, or Statistics), and
the start/stop logging options. Select the
Turn LCD off
checkbox to turn off the logger LCD.
This pane also displays the logging duration, which is the approximate time it takes to fill the logger
memory based on the logging interval, sensors, and other settings currently selected.
To configure a test launch, set
Start Logging
to Now, choose a fast logging interval (such as 30 seconds),
change any other settings as desired, and then click
Start
. The software displays the progress of the launch and
warns you not to unplug the logger while it is being configured.
Normally, when the launch is finished you unplug and deploy the logger. For this test, leave the logger plugged
in so you can become familiar with checking the status, reading it out, and plotting data.
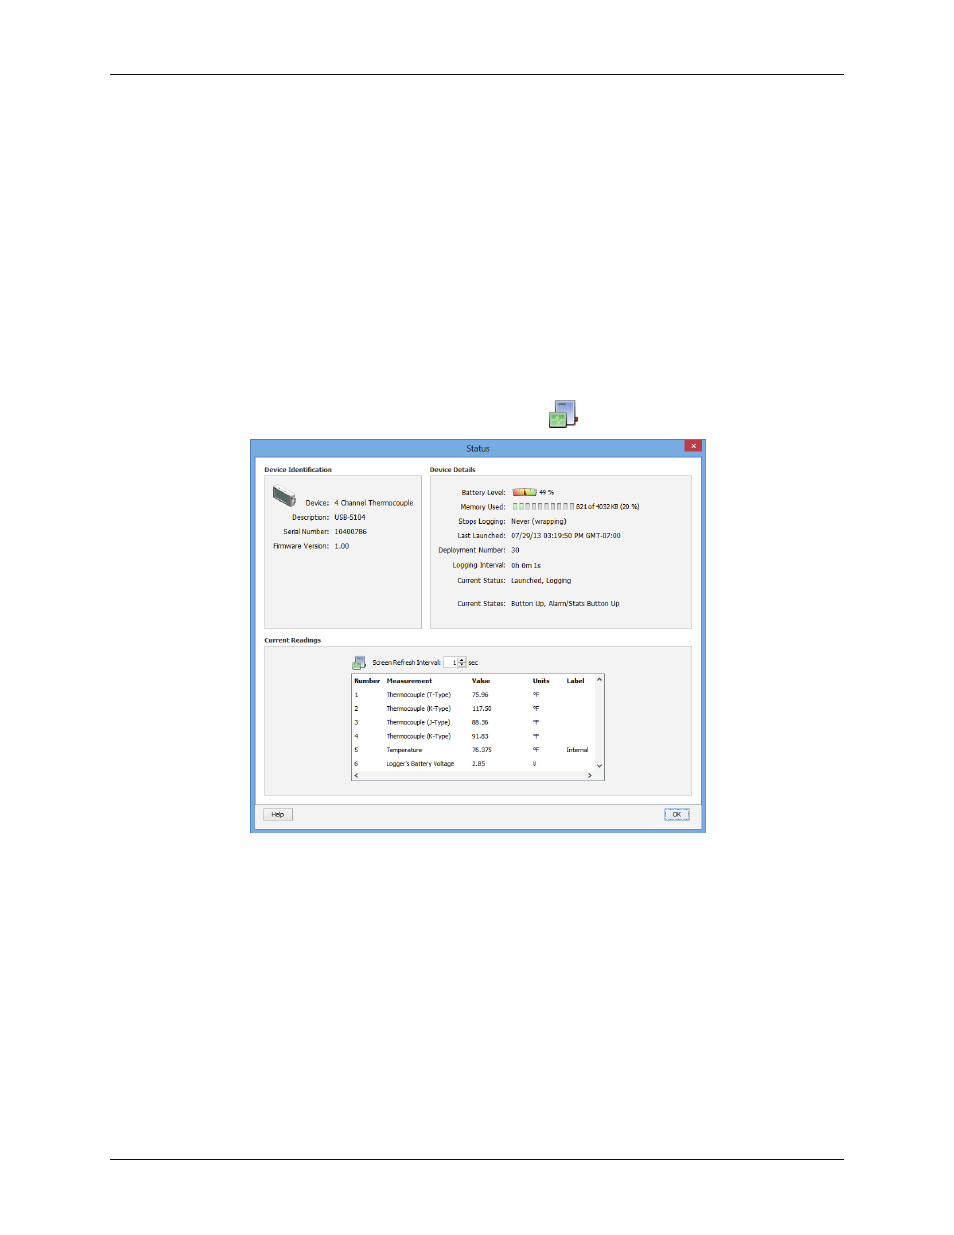
Checking Logger Status
To check the logger status, click the
Device
Status
toolbar icon.
The
Status
window opens:
Device Identification
: This pane displays the device type, the description entered at launch time, the serial
number, and the firmware version for the logger currently connected.
Device Details
: This pane displays specifics about the device, including battery level, memory used, when
it is scheduled to stop logging (if applicable), date of the last launch, the deployment number, logging
interval, current status and current state (if applicable).
Current Readings
: This pane shows the latest readings for configured sensors and derived series.
Testing the Logger and Sensors
Perform the following steps to verify that the logger and sensors are working and recording data properly. When
you plot the data, you should see the results of these tests in the graph.
1. Force a change in the temperature by holding the sensor in your hands for a minute or two.
2. Observe that the
Current Readings
in the
Status
window update as the temperature changes.