Monroe Electronics R165A User Manual
Page 9
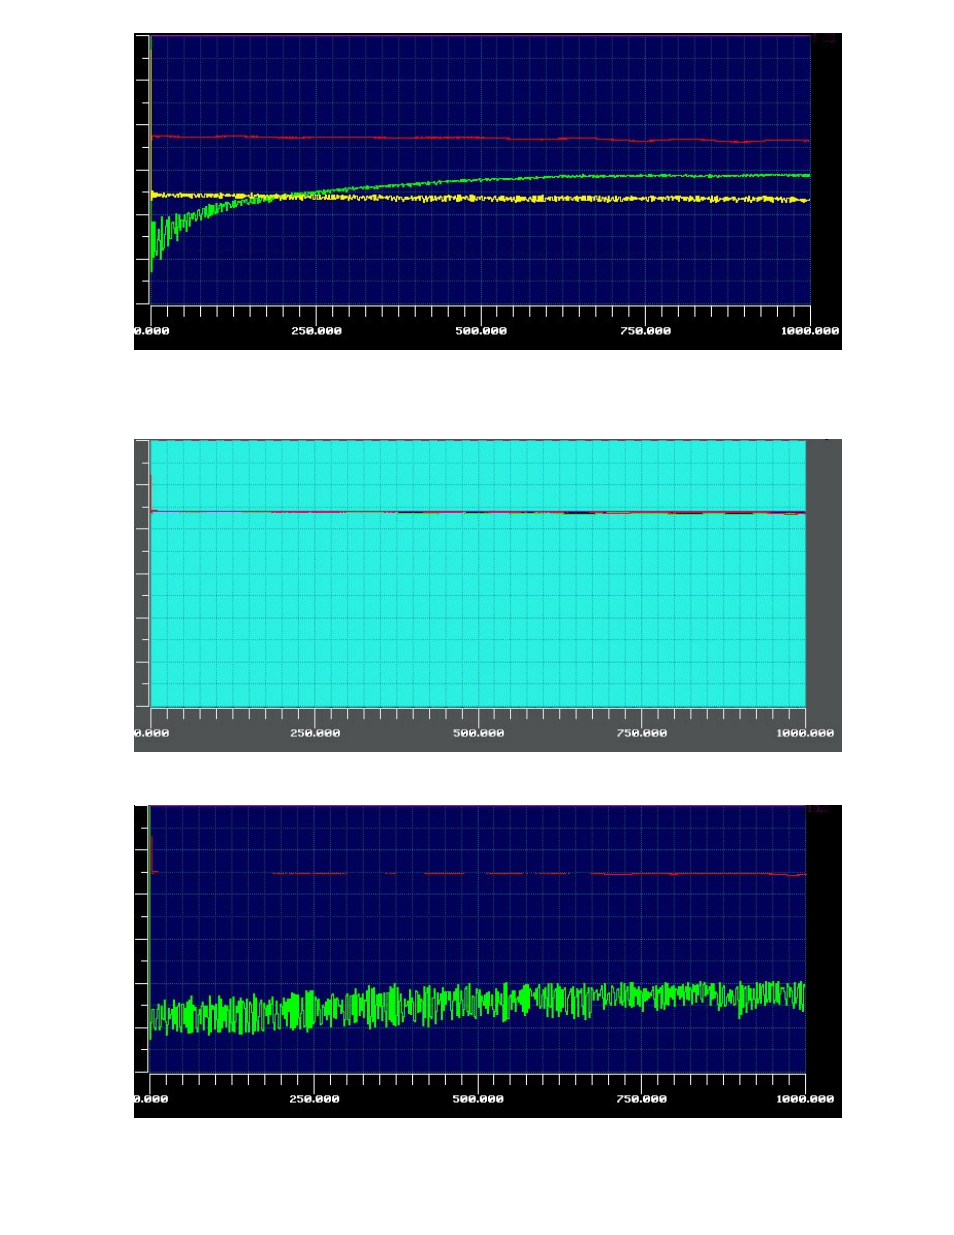
This graph demonstrates the Return Loss of a typical switch input. Red shows the signal through the
Bridge with no connection. The yellow shows the signal when the bridge is terminated with a –26 dB
Loss load, and the green shows the return loss when the bridge output is connected to the normally
Closed switch input with a 75 ohm load on the output.
This graph shows attenuation of the signal from a switch that is ON to the output. [10 db per division,
0 to 1000 MHz]
This graph demonstrates the isolation from a switch that is OFF to the output. [10 db per division, 0 to
1000 MHz]