Graphical screen controls, 3 graphical screen controls – Sonnox Oxford SuprEsser User Manual
Page 32
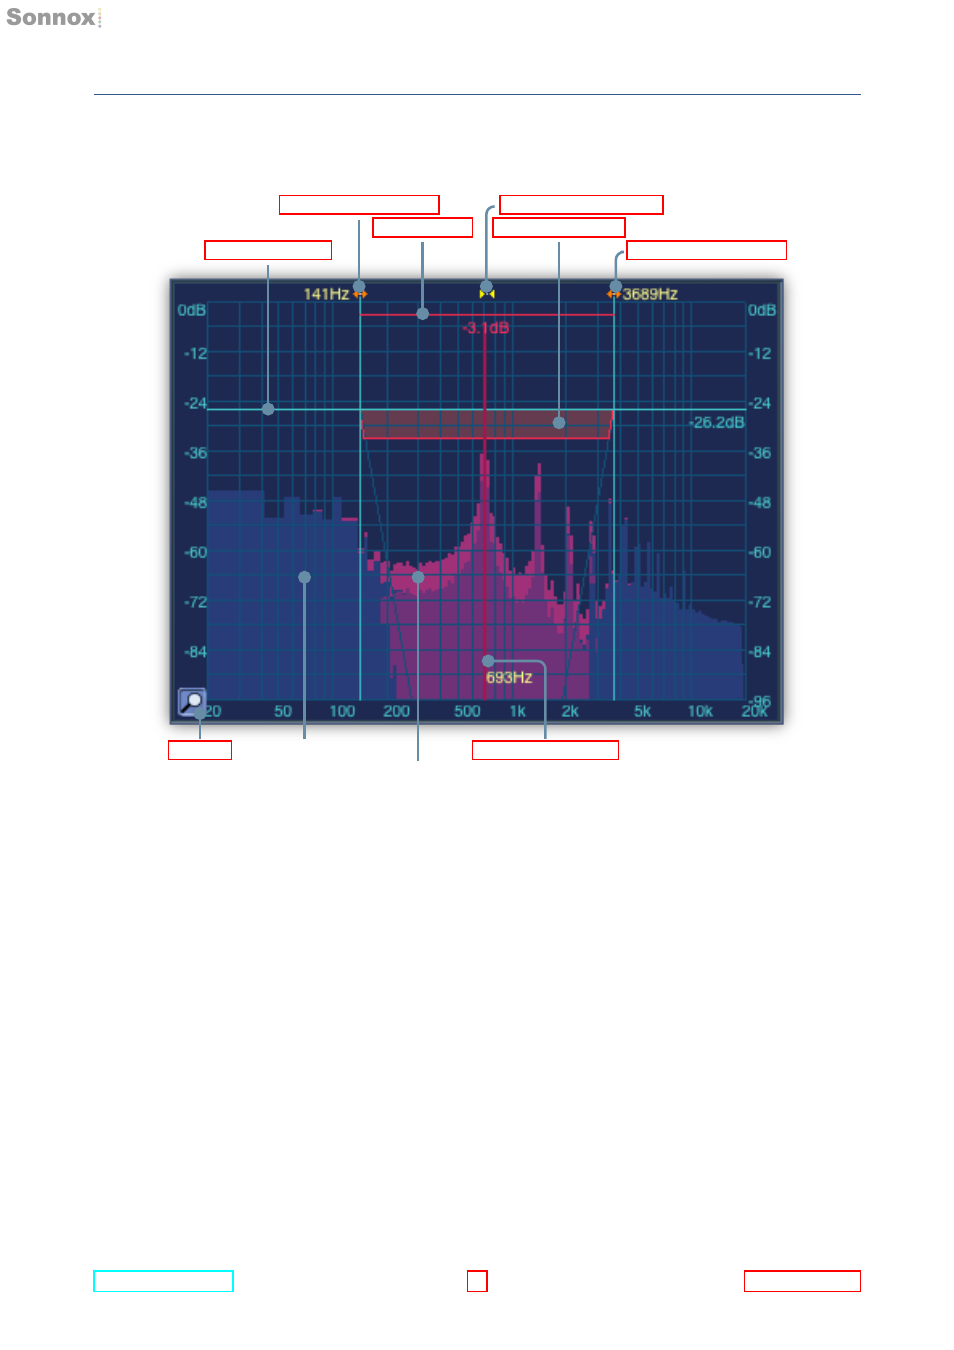
4.3 GraphicalScreenControls
4 DESCRIPTION OF CONTROLS
4.3 GraphicalScreenControls
Input Signal (8)
Inside Band Signal (7)
The Oxford SuprEsser’s graphical display is the key to its intuitive operation. This display
provides all the important pieces of information you need to access visually and quickly,
such as the correct threshold and filter frequency values.
In the following descriptions, references are provided to the illustration’s annotation in the
form
(1).
In operation, you will see a FFT (Fast Fourier Transform) of the input signal
(8) with a pink
region above showing the effect of the gain reduction. The FFTs are plotted on a
logarithmic scale, and related to actual dB values, so you get a clear idea of how much
energy is in a given frequency band.
The FFT shows an important red peak-held vertical line
(10). This peak value is useful
because it shows you the frequency with the highest energy within the bandpass window.
This gives a good indication of where the centre of the ‘ess’ sound is. Clicking on this
peak will centre the window to this frequency, thus isolating it better.