Hanna Instruments HI 4105 User Manual
Page 8
14
15
Typical calibration curve for HI 4105 Carbon Dioxide ISE
•
Standards and solutions should be at the same tem-
perature. 10 mL of ISA is added to each 100 mL of
sample and standard.
•
Protect these solutions from loss of dissolved gas by
covering and using promptly.
3. Follow section VII; General Guidelines to optimize test
set-up.
4. During calibration it is best to start with lower concen-
tration samples first. Wait for a stable reading before
reading/recording values (approximately 5 minutes).
5. To prevent carry over and contamination of samples,
rinse sensors with deionized water and dab dry be-
tween samples.
6. Between measurements suspend sensor tip in a small
sample of CO
2
Conditioning solution; HI 4005-45.
Rinse body with deionized water and dab dry before
placing in next sample.
7. Check HI 4105 electrode calibration every 2 hours by
verification of at least one calibration point.
XIII.
XIII.
XIII.
XIII.
XIII. Direct Calibration and Measurement
Direct Calibration and Measurement
Direct Calibration and Measurement
Direct Calibration and Measurement
Direct Calibration and Measurement
The direct measurement method is best used in the linear
working regions of the sensor. (See figure for typical sensor
response) and can be used when measuring many samples.
A direct reading ISE meter (HI 4222 or equivalent) deter-
mines concentration of the unknown by a direct reading
after calibrating the meter with the standards. The meter is
calibrated with two or more freshly made standards that
are in the measurement range of the unknowns. HI 4005-
00 ISA is added prior to measurement and the solution is
stirred thoroughly and continuously. Covering the vessel to
prevent gas loss is advised.
A pH/mV meter in mV mode and semi-log graph paper
may also be used. Two or freshly prepared standards that
are in the measurement range of the unknowns (with ISA
added), are measured in mV mode on the meter. These
standards are plotted on semilog graph paper and their
points are connected to form a straight-line curve. When
samples are measured, their mV values are converted to
concentration by following the mV to the concentration axis
on the semi-log plot.
For both direct reading and mV convertion, ISA is added
prior to measurement, the solution stirred thoroughly and
continuously and the vessel should be covered to prevent
gas loss.
In the lower concentration ranges the electrode calibration
becomes less linear, many more calibration points are
needed, and calibration will need to be repeated more
frequently. Known addition method may also be used in
these regions provided the actual slope of the sensor has
been determined.
Direct Measurement Procedure
1. Follow section IX to prepare sensor.
2. Follow section VI to prepare standards and solutions.
•
Standards should bracket the measurement range of
interest and differ from each other by a factor of 10 in
the linear regions.
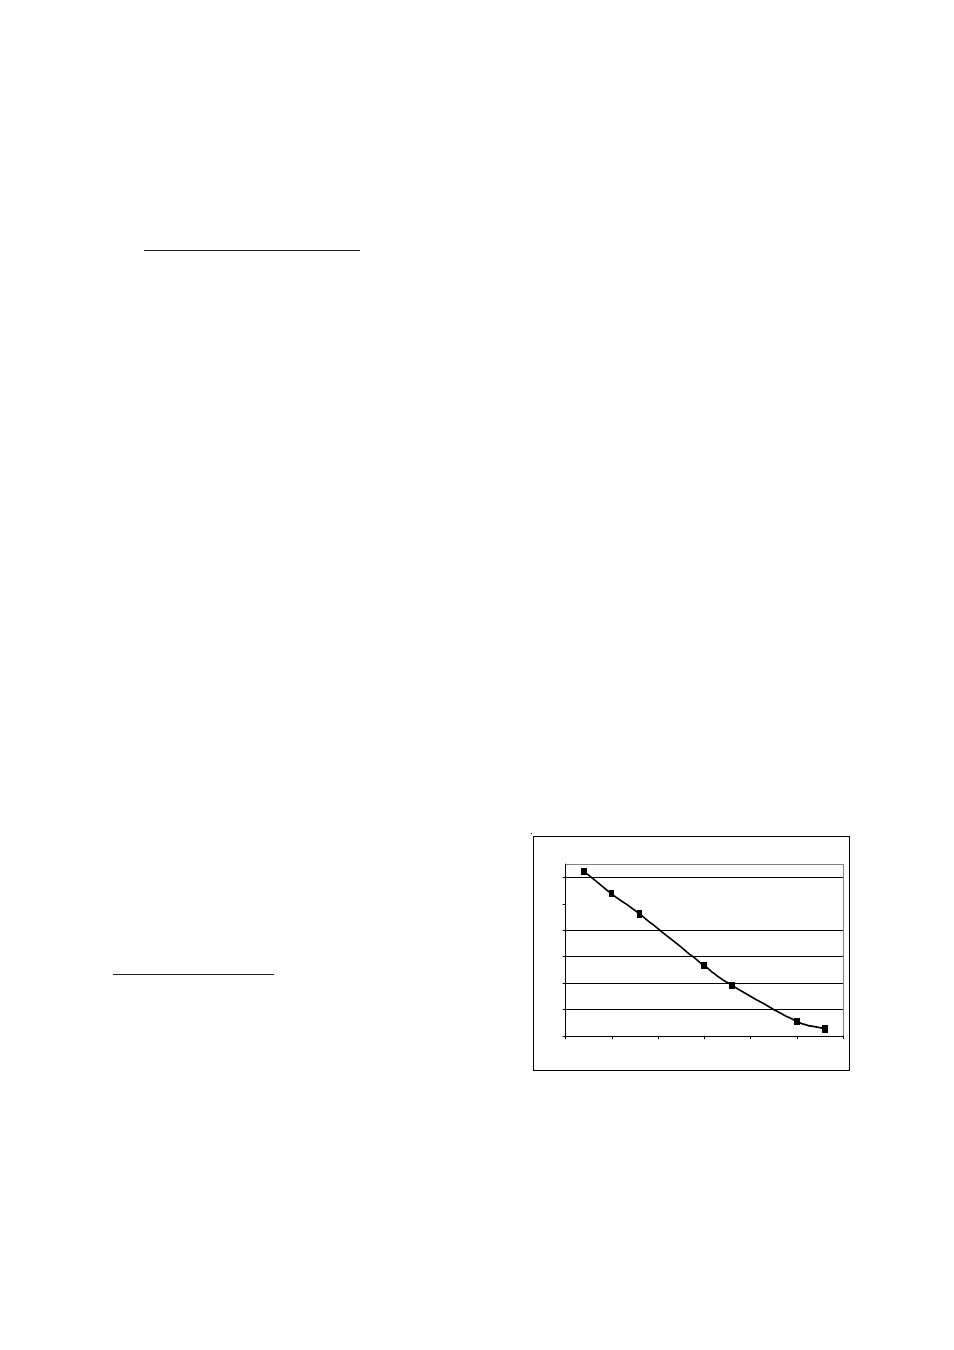
Typical response for HI 4105 Carbon Dioxide sensor
-170
-150
-130
-110
-90
-70
-50
1.5
2
2.5
3
3.5
4
4.5
-log[M]
mV