Casio ALGEBRA FX 2.0 PLUS User Manual
Page 30
20010101
After setting all the parameters, align the cursor with [Execute] and then press one of the
function keys shown below to perform the calculation or draw the graph.
• 1(CALC) ... Performs the calculation.
• 6(DRAW) ... Draws the graph.
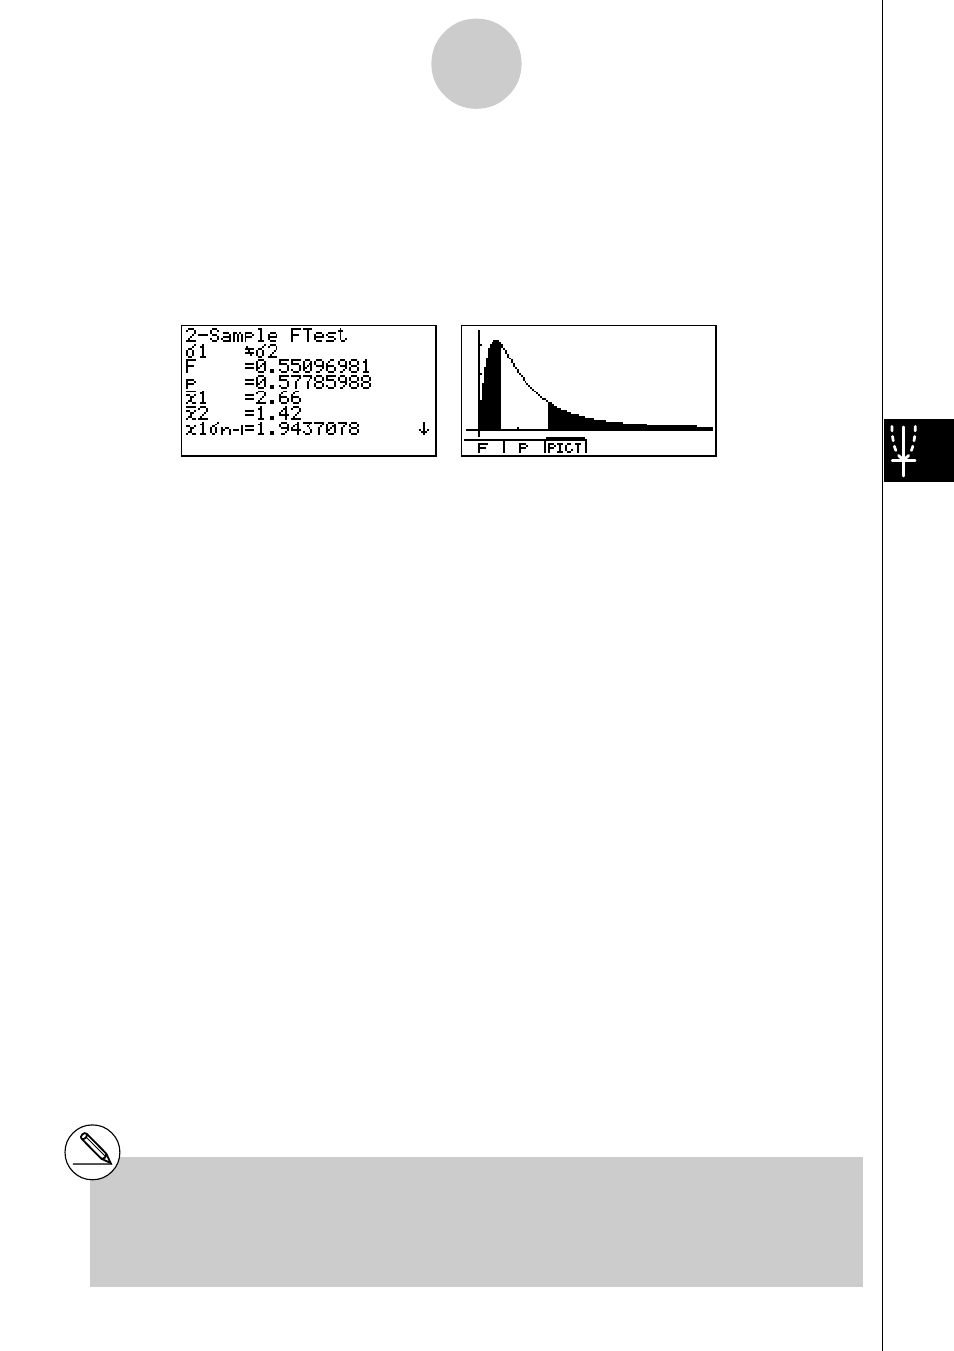
Calculation Result Output Example
σ
1
G
σ
2
.......................... direction of test
F
..................................
F
value
p
.................................. p-value
o
1
................................. mean of sample 1 (Displayed only for Data: List setting.)
o
2
................................. mean of sample 2 (Displayed only for Data: List setting.)
x
1
σ
n
-1
............................ standard deviation of sample 1
x
2
σ
n
-1
............................ standard deviation of sample 2
n
1
................................. size of sample 1
n
2
................................. size of sample 2
You can use the following graph analysis functions after drawing a graph.
• 1(F) ... Displays
F
value.
Pressing 1 (F) displays the
F
value at the bottom of the display, and displays the pointer at
the corresponding location in the graph (unless the location is off the graph screen).
Two points are displayed in the case of a two-tail test. Use
d and e to move the pointer.
Press i to clear the
F
value.
• 2(P) ... Displays p-value.
Pressing 2 (P) displays the p-value at the bottom of the display without displaying the pointer.
Press i to clear the p-value.
# [Save Res] does not save the
σ
1
condition in
line 2.
# V-Window settings are automatically
optimized for drawing the graph.
# Executing an analysis function automatically
stores the
F
and p values in alpha variables
F and P, respectively.
1-2-21
Tests (TEST)