Scientific calculators, Geometric graphing functions, Eactivity and presentation applications – Casio Electronic Calculator User Manual
Page 3: Dimensional graphing 1, Built-in software, Eactivity, The eactivity has four advantages over using paper
SCIENTIFIC CALCULATORS
SCIENTIFIC CALCULATORS
Scientific Calculator Tools for the classroom, the research laboratory, and everywhere in between.
Financial Consultant Quick solutions to complex financial calculations at your fingertips.
3
*Comes with
snap-on hard case
240 dots
240 dots
240 dots
160 dots
160 dots
160 dots
Big Display
The ClassPad 300PLUS features a
large 160 by 240-dot LCD that
enables easy and definite entering
of data and selection of menu
commands with the stylus.
New Crisp &
Clear Display
CASIO’s new ClassPad 300PLUS
incorporates an impressive
bold-type font and a crisp & clear
display that provides almost
double the character-visibility of
the previous model.
Pen Touch Operation
Various commands can be selected from the pull-down menu using the
stylus. Also, you can use the Drag & Drop or Copy & Paste functions for
efficient operations.
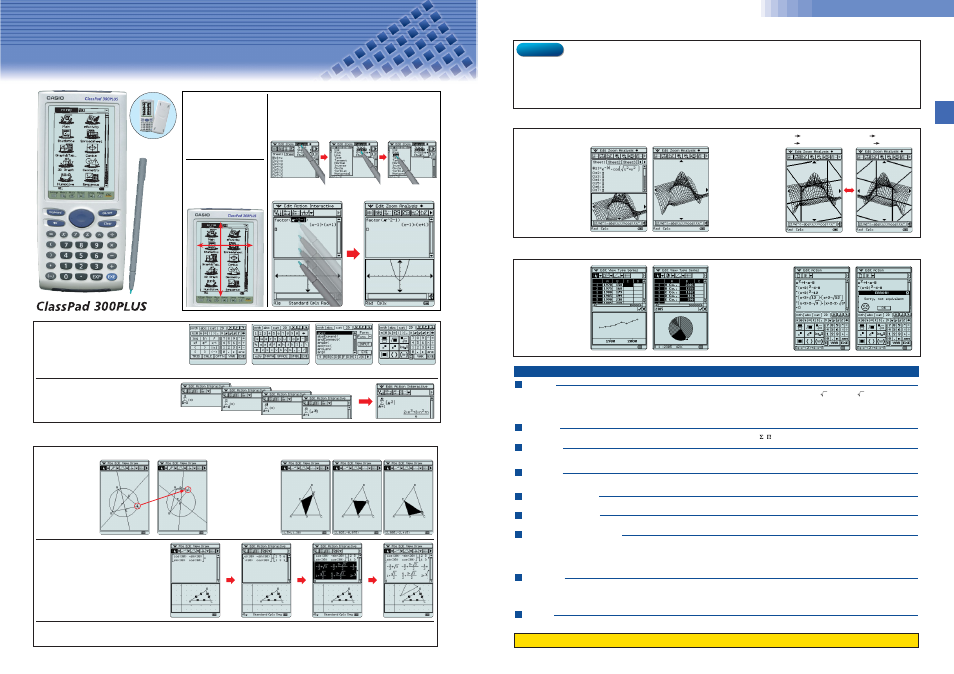
Geometric Graphing Functions
Drag & Drop
numerical
data
Drag & Drop
geometric
figure
Geometry Link Function
The Geometry Link function enables you to dynamically link the eActivity data and the Geometry window data.
Math keyboard
Catalogue keyboard
Alphabet keyboard
2D keyboard
Soft Keyboard
The Soft Keyboard is very efficient for entering various commands
or entering complex expressions in natural display format, and it
makes the input operations remarkably simple. With this function,
it is unnecessary to follow the complicated input method unique
to conventional scientific calculators. The ClassPad 300PLUS
provides Soft Keyboards of four different display types.
Natural Input
The Natural Input/Output function enables you to input and
display expressions or display the results of the calculation in
the same format shown in the textbook.
Geometric Graphing
As shown in the following
examples, the students
can learn the general
theorem by drawing the
figures, and they can
confirm that the theorem
still holds true even
when they deform the
triangle.
The Animation function
enables you to move the
drawn geometric figures.
With this function, the
students can learn
visually, for example,
how the figure changes
when the angles and the
values of the coordinates
are changed.
Geometric Graphing by using
the Drag & Drop Function
By dragging and dropping a geometric figure to the
main application window, you can obtain the
numerical data for the figure. And by dragging and
dropping the numerical data to the Geometry window,
the data can be reflected in the figure.
eActivity and Presentation Applications
eActivity
eActivity
3-dimensional Graphing
1.
You can create and prepare your own original activities for the class with eActivity.
2.
Students can work on a problem at their own pace.
3.
Students can try out various approaches to solving a problem by themselves.
4.
It enables texts, expressions, figures and graphs to be presented on the screen of the ClassPad 300PLUS.
The eActivity has four advantages over using paper:
• Hyperbolic (sinh, cosh, tanh, sinh
–1
, cosh
–1
, tanh
–1
) • Integration, differential • Differential equation • , , lim
• List-based one- and two-variable statistical analysis • Statistical regression calculations • Statistical plot (Scatter Plot, xyLine, Normal Probability Plot, Histogram,
Box Plot) • Statistical regression graphs • Advanced statistical calculations (Tests, Intervals, Probability)
• Constraint geometry (for education) • Construction figures (Perpendicular, Midpoint, Intersection, Angle Bisector) • Geometry figures (Circle, Ellipse, Triangle, Rectangle,
n-gon, Point, Line Segment) • Geometry animation • Numeric evaluation of geometry animation in tables
• Creating eActivity • Exploring (performing) eActivity • Geometry Link in eActivity
• Drag & Drop operation • Natural format input of equations and expressions • Natural format display of results • Math, Alphabet, 2D soft keyboards • Command catalogue
soft keyboard • Calculation History • Mantissa + exponent: 15 + 3 • Interactive manipulation for solving equations • 3-dimensional graphs • Numeric equation solver
• Presentation feature • User memory capacity: 515,000 bytes (max.) – Depending on remaining memory capacity • Icon menus • Full screen display/Split screen display
• Software upgradability (maintenance, feature upgrades)
• User-defined variable • User-defined function (extends built-in functionality) • Memory Management to create
folders • Sending screen image from unit to unit • Resetting/initializing memory • Selection of display language • Auto Power Off (APO) • Ending screen/User-defined ending screen
• ClassPad Manager • EA-200 Data Analyzer • RM-ClassPad PLUS (SET) (0verhead projectable model)
• Dimensions: 21.0 (H)
ϫ 84.0 (W) ϫ 189.5 (D) mm • Approximate weight: 280 g • Battery type: Four AAA-size batteries LR03 (AM4) • Battery life: Approx. 140 hours continuous
operation (assuming 5 minutes calculation and 55 minutes display per hour) • Display type: 160
ϫ 240-dot display (LCD) • Touch Panel (Pen Touch Operation)
• User-available RAM: 500KB • User-available Flash ROM (Add-in area): 4MB • Data communication (via USB and 3-pin cables) • USB cable for connecting with PC
• 3-pin cable for connecting with other ClassPad unit or EA-200
ALGEBRA
CALCULUS
STATISTICS
GEOMETRY
eActivity APPLICATION
• E-Con EA-200
ADD-IN APPLICATIONS
OTHER EFFECTIVE FEATURES
HARDWARE
OPTIONS
• CAS (Computer Algebra System) • Algebra Assistant • Fraction • Transformation function (simplify, expand, factor) • Algebraic ( , x
2
, x
–1
, x!,
n
, x
n
) • Simultaneous
equation • Real and complex results • Data (List, Matrix)
• Combination nCr, Permutation nPr
• Exponent (log, ln, 10
x
, e
x
) • Trigonometric (sin, cos, tan, sin
–1
, cos
–1
,
tan
–1
) • Angle unit (Deg, Rad)
• Graph functions, polar, parametric and x = f ( y) equations • Numeric evaluation of functions in tables
• Graph solve (root, max, integral,
inflection, distance)
• Conics graphs (Parabola, Circle, Ellipse, Hyperbola, General figure)
• Conics graphs solve (Focus, Vertex, Directrix, Symmetry, Center, Radius)
• Recursive and explicit sequence numerical tables and plots
ClassPad 300PLUS Specifications
For more information on the ClassPad 300PLUS, please visit our website:
http://classpad.net/
3-dimensional Graphing
The 3-dimensional
Graphing function enables
you to draw and display a
3-dimensional graph
defined by the formula
z = f (x, y). You can split
the display window into 3D
Graph Editor window and
3D Graph window, or
enlarge the 3D Graph
window to see a larger
graph.
Left Right
Top Bottom
Right Left
Bottom Top
You can rotate the graph as
you like by selecting and
tapping one of the following
commands from the menu.
Built-in Software
Spreadsheet
Verify
With this function, you can
organize and tabularize the
collected data or use it for
analysis after drawing a
statistical graph. Of course,
it can also be used
effectively for table
calculations.
With the Verify function, you
can transform expressions or
adopt solutions in your own
way. The unit will verify
whether the input calculation
formula is in an equivalent
relation with the adjacent
expression. This function is
just perfect for learning how
to do equation and integration
calculations.
4
SCIENTIFIC CALCULATORS