ChemoMetec NC-3000 User Manual
Page 6
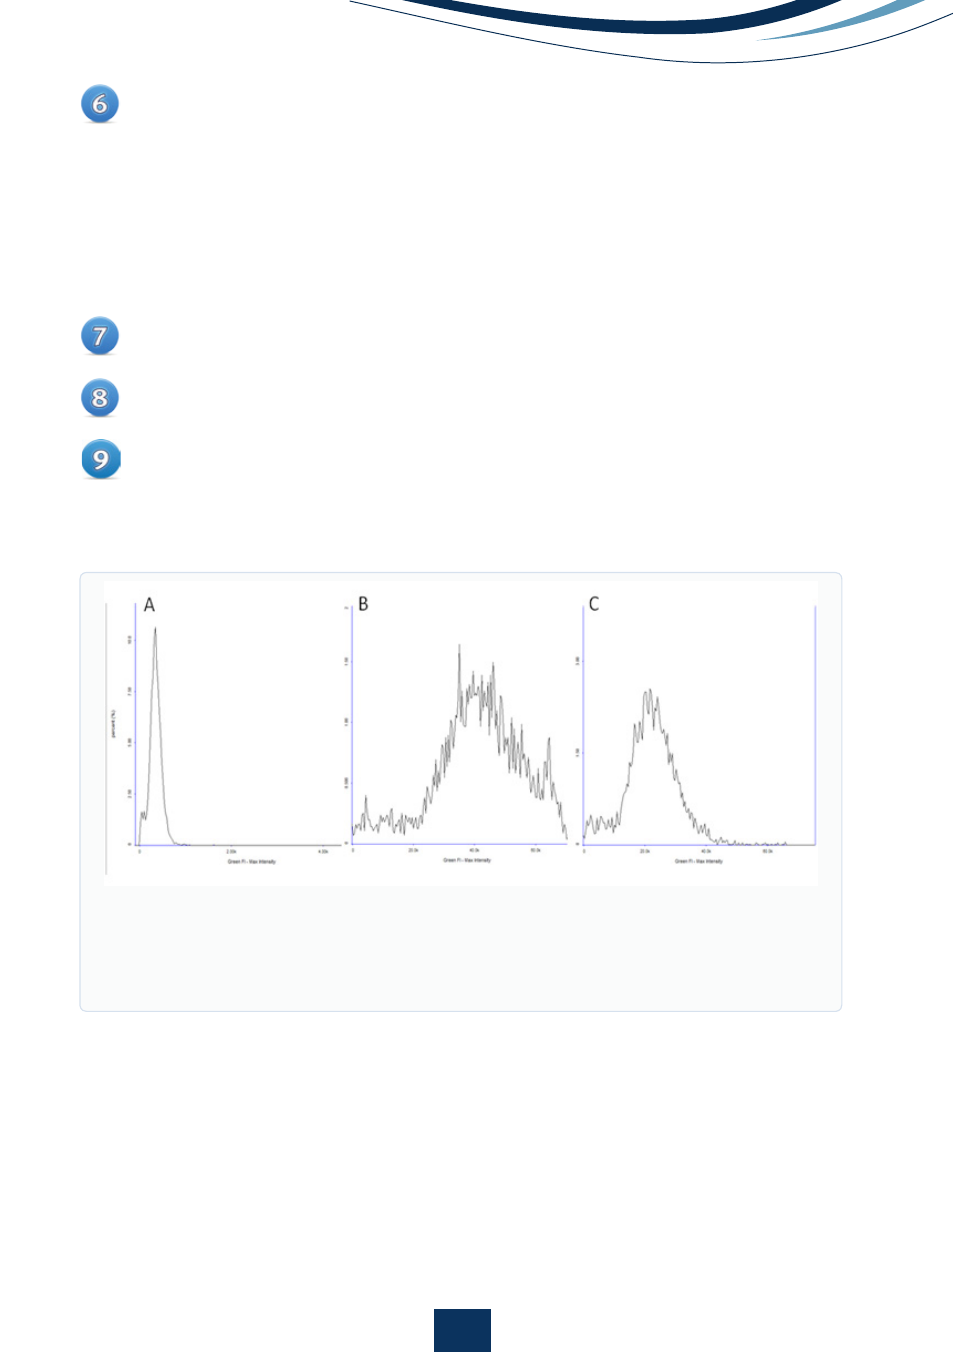
To evaluate if the exposure time for the channel is appropriate for a par-
ticular channel, examine the distribution of the signal in the histogram.
The NC-3000 is based on 16-bit imaging that allows acquisition of signals
from approx. 0 - 65,500. If the image is under-exposed ‘normal distribu-
tion’ curve may rest against the y-axis and lower intensity events will not
be acquired (Fig 4A). If the image is over-exposed, the maximum intensity
values will be close to 65,000 and a shoulder may be seen on the ‘normal
distribution’ curve (Fig 4B).
If required, adjust the exposure time for your sample as appropriate and
repeat steps 2 - 6.
Steps 2 - 7 should then be repeated for all channels used in the final as-
say.
Once the optimal exposure time has been determined for the individual
channels, a final protocol with optimized exposure times for all the chan-
nels is saved in the ‘Protocol Adaption Wizard’.
5
Figure 4
.
Max Intensity histograms for A) Under-exposed image, B) Over-
exposed image with a shoulder indicating saturated pixels and C) an
image with correct exposure. Note the smaller scale on the under-exposed
image is different so that the peak can be more readily visualized.