ChemoMetec NC-3000 User Manual
Page 17
16
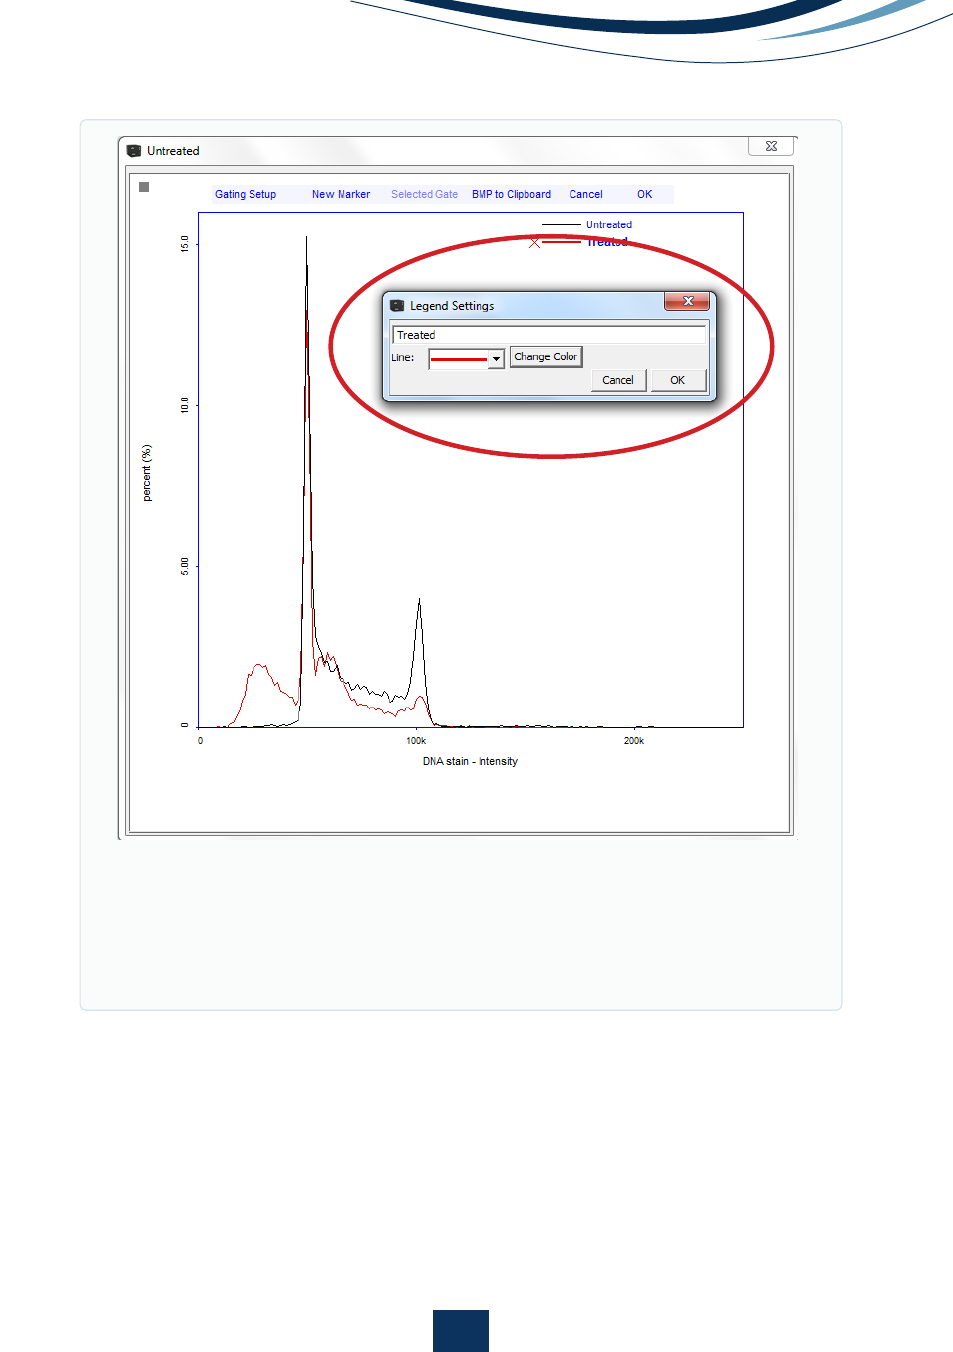
Figure 9
.
Large histogram plot displaying an overlay of a standard cell cycle
profile (red line) on a histogram of a cell cycle showing DNA fragmentation
(black solid line). Buttons for removing histograms and pop-up window for
modifying line color and form along with text input fields are encircled in
red.