Graph tab, Zoom the x-axis, Zoom the y-axis – Monarch Instrument Android Application User Manual
Page 6
RFID Logger Android App User Guide
Page 6
6. GRAPH TAB
Pressing the GRAPH TAB will cause the application to read ALL the data from the logger if it has not
already done so. The logger needs to be held in the NFC antenna area for the duration of the read which
will be around 8 to 10 seconds. Once reading starts the “Reading” window pops up as
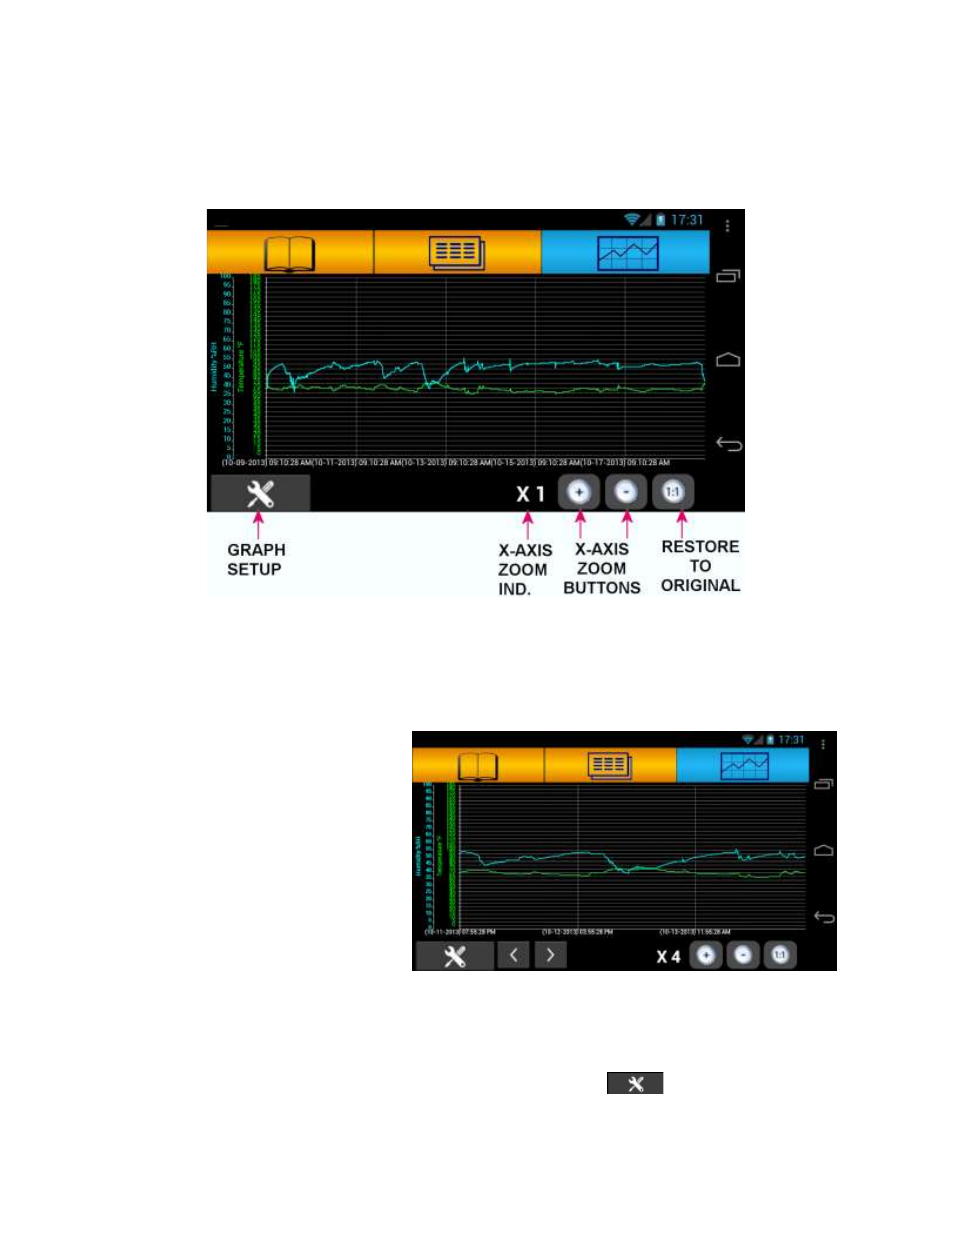
data is read and processed. The data is then displayed as a graph as shown below.
The graph will contain 1 or more traces depending on the logger type with the Y axes scales on the left.
The default graph shows all data (X-Axis zoom = x1 as shown by the Zoom Indicator) with no zoom in the
y-Axis.
6.1. Zoom the X-Axis:
The X-Axis can be zoomed up to 16 times
in powers of 2 (1,2,4,8,16) by pressing
the X-Axis Zoom “+” button. Pressing the
X-Axis Zoom “–“ button will zoom out.
Any time the X-Axis is zoomed in, the
navigation buttons “<” and “>” will
appear. By pressing these buttons you
can move back and forward through the
data.
The RESTORE TO ORIGINAL button “1:1”
will return the X-Axis and Y-Axis to the
default (as loaded) condition. Note: This will not affect the Y-Axis if it is set to Auto-scale. See below
6.2. Zoom the Y-Axis:
The Y-Axis scaling can be customized using the GRAPH SETUP button
. Pressing this button will
pop up the Graph setup window shown below