AiM SportsAgenda User Manual
Page 30
SportsAgenda
User manual
Release 1.03
www.aim-sportline.com/mytach
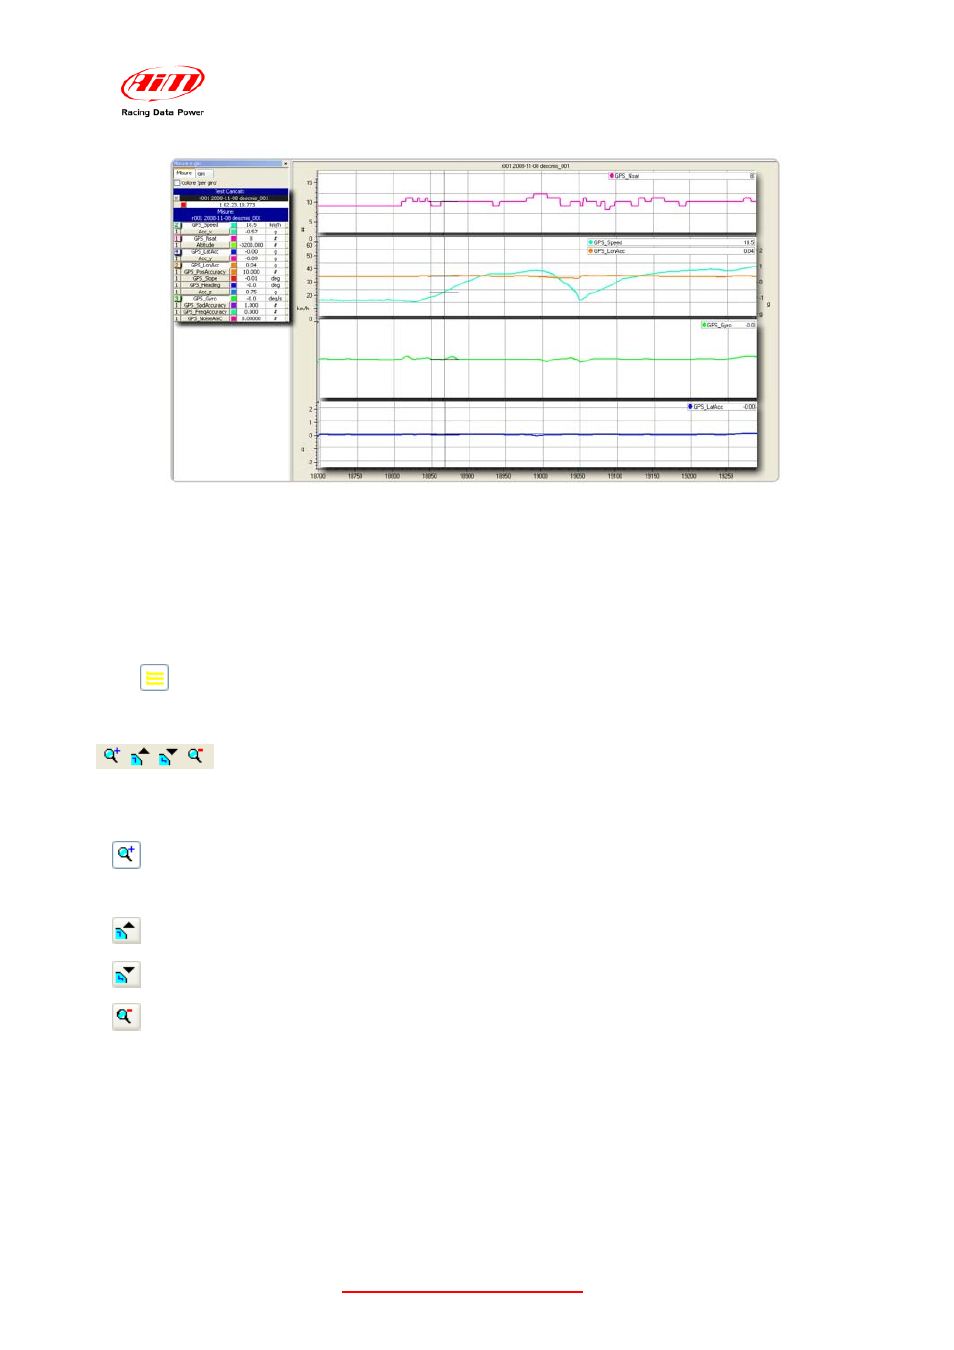
With reference to the above image:
• enable “Show mixed graph”;
• select the channels to be seen clicking the channel name (left panel);
• click the grey button on the left of the channel name until the number of the box where
the graph is to be inserted appears. It is possible to insert more channels in the same
box. The above image shows in the second box from the top two measures in the
same graph.
Show graphs tilled
This mode shows a different graph for each selected measure.
Zoom
To zoom the measure graph use the icons listed here below:
Allows to enlarge a specific part of the graph.
• Click the icon to enable it.
• Select the part of the graph to be enlarged using the mouse pointer (keep
it pressed).
Allows to enlarge the graph, keeping the point where the mouse pointer is
placed at the center.
Allows to reduce the graph keeping the point where the mouse pointer is
placed at the center
Allows to show all enabled laps in “Measures graph” window.
30