Performance curves, Performance chart parameters – Liebherr T 284 User Manual
Page 19
T 284
19
EVW
A
220
200
180
160
140
320
300
280
260
240
360
340
120
100
450
500
550
600
650
700
750
800
850
900
950
100
1050
1100
1150
1200
1300
1350
1400
1250
200
Gross Vehicle Weight x 1000
Speed
Rimpull
Per
cent ef
fective grade
kg
lb
300
400
500
600
80
60
40
20
0
0
4
8
12
16
20
24
28
32
36
40
40
48
mph
km/h
0
16
15
14
13
12
11
10
23
24
22
21
20
19
18
17
9
8
7
6
5
4
3
2
1
5
10
15
20
25
30
35
40
45
50
55
60
70
75
80
65
0
100
200
300
400
500
600
700
800
900
1000
1100
1200
1300
1400
1500
1600
kN
Lbf x 1000
C
B
GVW
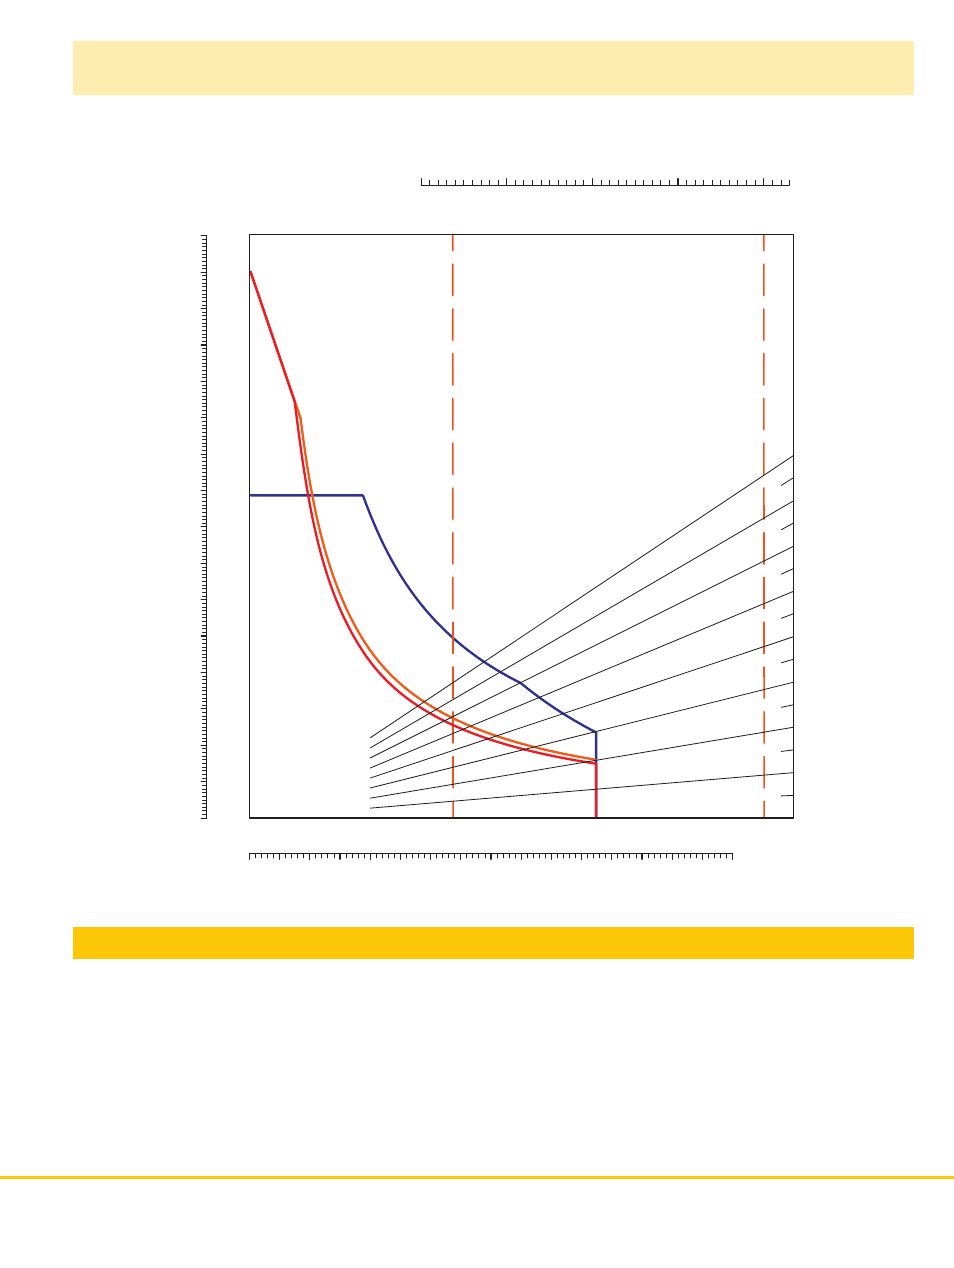
Performance Curves
Performance Chart Parameters
Gross Power
___________________
2,800 kW / 3,755 HP (A)
3,000 kW / 4,023 HP (B)
Net Power
_______________________
2,614 kW / 3,505 HP (A)
2,814 kW / 3,774 HP (B)
Tire size
__________________________
59.80 R63
Gear ratio
_______________________
43.7 to 1
Reference curves
_____________
A: Propulsion 2,800 kW / 3,755 HP
B: Propulsion 3,000 kW / 4,023 HP
C: Dynamic Braking (Retard)
Note
The propulsion curve is calculated using net horsepower, therefore site
specific and climatic variables will have an effect on the parasitic loss
estimations.
EVW: Empty Vehicle Weight
GVW: Gross Vehicle Weight