3 interpreting resistance values, 4 calculating wet time fraction – Campbell Scientific 237-L Leaf Wetness Sensor User Manual
Page 7
Model 237 Leaf Wetness Sensor
3.3 Interpreting Resistance Values
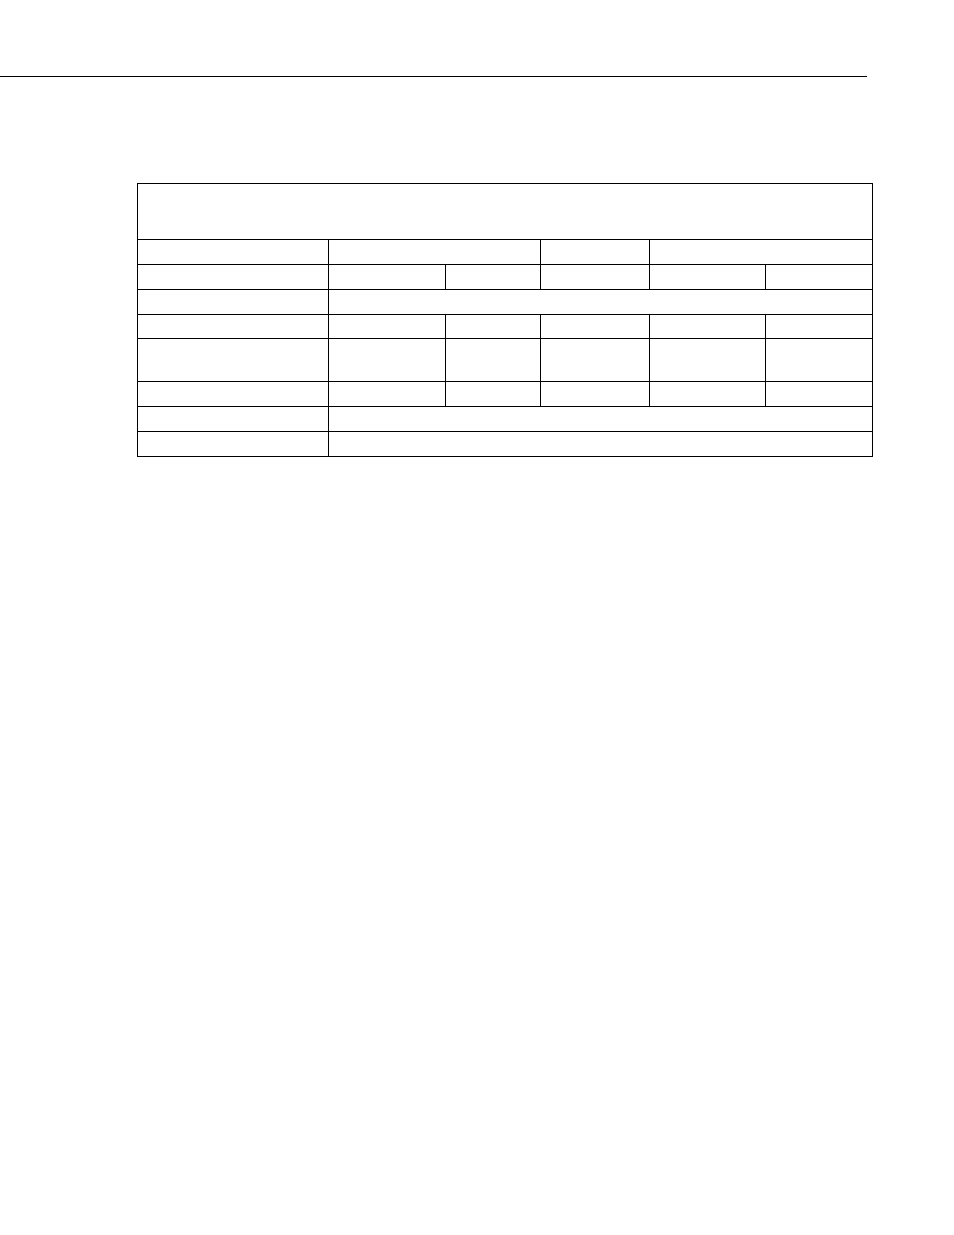
Table 3 lists 237 sensor resistance ranges and their interpretation.
TABLE 3. 237 Resistance Interpretations
(Wet / Dry Threshold Set at 150 kΩ)
CR1000
CR200(X)
CR10X
Interpretation IEEE4
a
FP2
b
IEEE4
a,b
Input
Loc
a
Low Res FS
b
Wet
0 to 150
Slightly Wet
150 to ≥ 99999
150 to 7999
150 to ≥ 9999
150 to ≥ 99999
150 to 6999
Dry
c
INF, ≥ 99999,
≤ -99999
INF, ±7999
-INF, ≥ 9999,
≤ -9999
INF, ≥ 99999,
≤ -99999
±6999
Voltage Input Over-range
d
NAN NAN -100,
-INF -101
-101
Bridge Over-range
e
<
0
Missing Sensor
f
Any
Value
a
Input Memory
b
Final Storage Memory
c
The 1 kΩ bridge resistor holds the input channel at 0 mV when the sensor is completely dry.
However, the measurement may intermittently deviate from zero slightly, but still be within the
resolution specifications of the datalogger. When this occurs, Rs = either a very large or a very
small number.
d
Voltage input over-range is a state wherein voltage from the sensor exceeds the recommended 25
mV input voltage range. This highly conductive state may occur if the sensor is very very wet with
very ionic water.
e
If the measured voltage exceeds 24.75 mV, but does not exceed the input voltage range, the result
of the bridge equation becomes negative.
f
When no sensor is connected, or a cable has been cleanly cut, a “floating” voltage can occur and
falsely indicate the presence of a missing sensor. In the CR1000, this can be avoided by using the
mv25c range code.
3.4 Calculating Wet Time Fraction
Fraction of time wet are common data derived from 237 measurements.
Calculating time fraction requires a wetness threshold. Refer to Section 5.4
Calibration for more information on determining the threshold.
Fraction of time wet is calculated in all current Campbell Scientific
dataloggers, except the CR200(X), by using the Histogram instruction (P75 in
Edlog / Histogram () in CRBasic) with a single bin and closed form. The bin
select value for the histogram is the Input Location / Variable containing sensor
resistance (Rs). The lower limit of the histogram is zero, and the upper limit is
the wet / dry threshold. This will give the fraction of the output interval that
the sensor is wet. A fraction of time wet of .33 when the output interval is one
hour means that the sensor was wet for 20 minutes during that hour.
Refer to programming example 4.3 for information on calculating fraction of
time wet with the CR200(X).
3