Uncertainty example, Uncertainty example -18 – Anritsu 0701012 User Manual
Page 36
Uncertainty of a Measurement
Using the Power Sensor
3-18
MA24106A UG
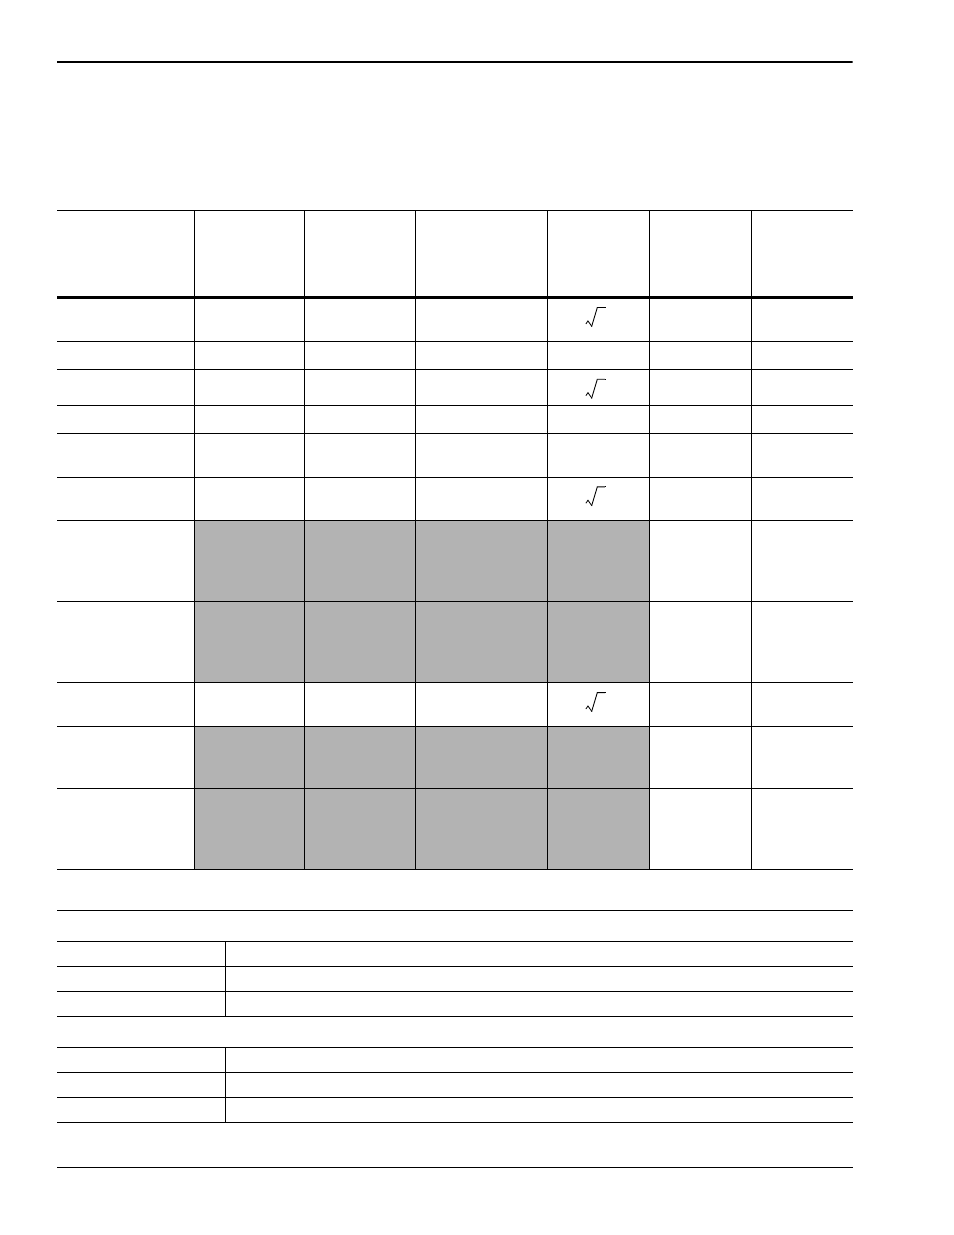
Uncertainty Example
An example of a measurement uncertainty calculation (for Low Aperture Time mode) is detailed for the
MA24106A in Table 3-4 below. The MA24106A is used to measure the power of a 3 GHz, +12.0 dBm and
–35 dBm CW signal from a signal source with 1.5:1 VSWR.
Table 3-4.
Measurement Uncertainty Example
Uncertainty
Term
Uncertainty
Specification
at +12 dBm
(%)
Uncertainty
Specification
at –35 dBm
(%)
Probability
Distribution
Divisor
Adjusted
Uncertainty
at +12 dBm
(%)
Adjusted
Uncertainty
at –35 dBm
(%)
Sensor Linearity
(<+18 dBm)
3.0
3.0
Rectangular
1.8
1.8
Noise
0.0
0.8
Normal at 2
σ
2
0.0
0.4
Zero Set
0.0
3.2
Rectangular
0.0
1.8
Zero Drift
0.0
0.9
Normal at 2
σ
2
0.0
0.5
Calibration Factor
Uncertainty
1.4
1.4
Normal at 2
σ
2
0.7
0.7
Mismatch
Uncertainty
4.0
4.0
Rectangular
2.3
2.3
Combined
Uncertainty
(RSS), Room
Temperature
3.0
3.6
Expanded
Uncertainty with
K=2, Room
Temperature
6.0
7.1
Temperature
Compensation
1.4
1.4
Rectangular
0.8
0.8
Combined
Uncertainty
(RSS, 0 to 50 °C)
3.1
3.6
Expanded
Uncertainty
with K=2
(RSS, 0 to 50 °C)
6.2
7.3
Table 3-5.
Noise Measurement Uncertainty Calculations
Noise Calculations at 12 dBm (16 mW):
Noise 400 nW/16 mW = 0.0%
Zero Set 1700 nW/16 mW = 0.0%
Zero Drift 500 nW/16 mW = 0.0%
Noise Calculations at –35 dBm (316 nW):
Noise 2.5 nW/316 nW = 0.8%
Zero Set 10 nW/316 nW = 3.2%
Zero Drift 3 nW/316 nW = 0.9%
3
3
3
3