3B Scientific Critical Point Apparatus User Manual
Page 4
4
the corresponding pressures p
0
and p
1
of the trapped
air, we get:
1
1
0
0
s
p
s
p
⋅
=
⋅
(2)
Substituting
s
s
s
Δ
+
=
1
0
and rearranging gives:
s
p
p
p
s
Δ
⋅
−
=
0
1
0
1
(3)
Rough calibration of scales:
•
Open the regulating valve wide.
•
Loosen the grub screw for the vernier scale by
half a turn (it is now possible to turn the scale
easily on the threaded axle without moving the
handwheel, although a counterpressure acts
against this independent movement).
•
Wind the handwheel out till you detect a notice-
able resistance.
•
Without turning the handwheel, turn the vernier
scale on the threaded axle till the 0.0 mark is on
the top and the fixed scale shows approx. 48 mm.
•
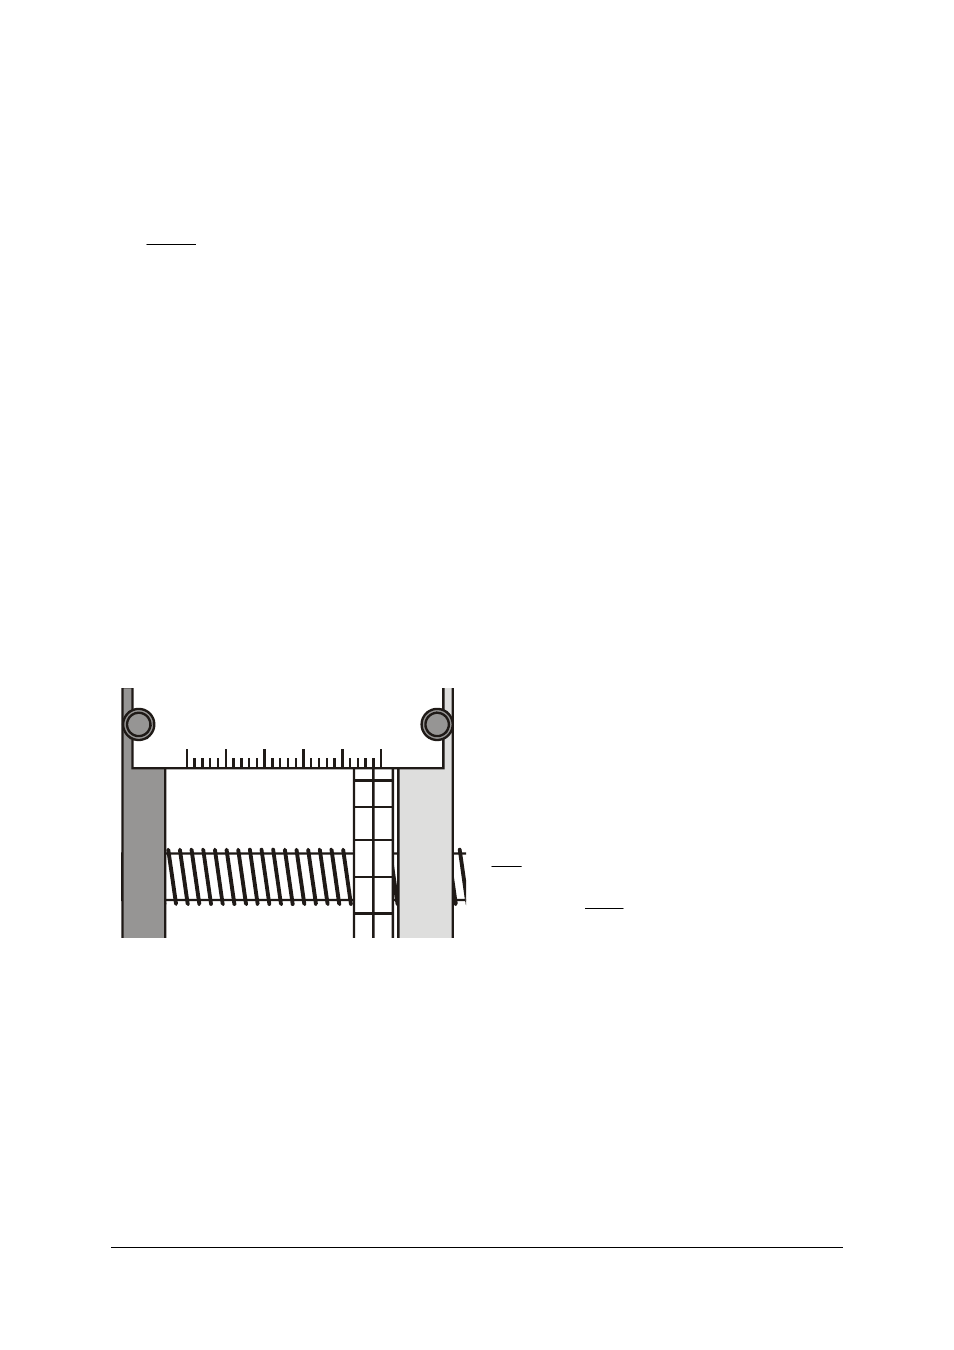
Loosen the knurled screws of the fixed scale and
shift the scale to the side till the 48-mm bar is ex-
actly above the centre line of the vernier scale
(see Fig. 2).
•
Tighten the knurled screws again. In doing so,
make sure that the fixed scale does not press
against the vernier scale.
0 0
1 9
1 8
1 7
1 6
1 5
10
0
20
30
40
50mm
Fig. 2: Piston position reading at 48.0 mm
Zero correction:
•
Shut the regulating valve (the pressure in the
measuring cell now corresponds to the ambient
pressure p
0
= 1 bar. To within the accuracy of the
measurement, the manometer should display an
excess pressure of 0 bar).
•
Wind the handwheel in till an excess pressure of
15
bar has been reached (absolute pressure
p
1
= 16 bar).
•
Read the piston position s
1
and calculate the
displacement
Δs = s
0
– s
1
.
•
Calculate the zero corrected piston position s
1, corr
using Equation 3.
•
Adjust the vernier scale to the corrected value
and, if necessary, move the scale again.
•
If required, wind the handwheel out a little and
secure the vernier scale with the grub screw.
Measurement example:
p
0
= 1 bar, p
1
= 16 bar, p
1
– p
0
= 15 bar
s
0
= 48.0 mm, s
1
= 3.5 mm,
Δs = 44.5 mm
Therefore, s
1, corr
= 2.97 mm.
The vernier scale must therefore be adjusted so that
now only 2.97 mm are shown instead of 3.50 mm.
Note:
After calibrating the zero point, it is possible to obtain
qualitatively accurate measured values. With regard
to temperature T and pressure p, it is also possible to
obtain quantitatively accurate measurements of the
isotherms in range around to the critical point where
the two phases exist simultaneously. However, espe-
cially in the liquid phase, the measured isotherms are
rather too widely separated.
6.3 Detailed calibration:
The exact relation between the volume V
G
in the
measuring cell and the scale reading s is dependent
on the volume of oil in the oil chamber. The oil
chamber also expands marginally in proportion to the
pressure as a result of the spring in the manometer
tube. Additionally, when the temperature is in-
creased, the castor oil expands to a greater extent
than the rest of the equipment. This means that the
pressure rises at a slightly greater rate at higher tem-
peratures. All of these phenomena can be calculated
if appropriate calibration has been effected using air
as an ideal gas.
The ideal gas equation would thus be:
R
n
T
V
p
⋅
=
⋅
(4)
with
mol
K
J
314
8.
R
=
After taking the overpressure reading p
e
, the absolute
pressure can be calculated from:
p
= p
e
+ 1 bar
(6)
The absolute temperature is given by:
T
=
ϑ + ϑ
0
where
ϑ
0
= 273.15°C
(7)
The volume is given by:
s
A
V
⋅
=
G
(8)
where
2
cm
14
3,
A
=
and s is the “effective” piston
displacement.
From the measured displacement s
e
, it is possible to
calculate the effective piston displacement as follows: