3B Scientific Teltron NMR Supplementary Set User Manual
Page 4
4
7.4 Experiment procedure
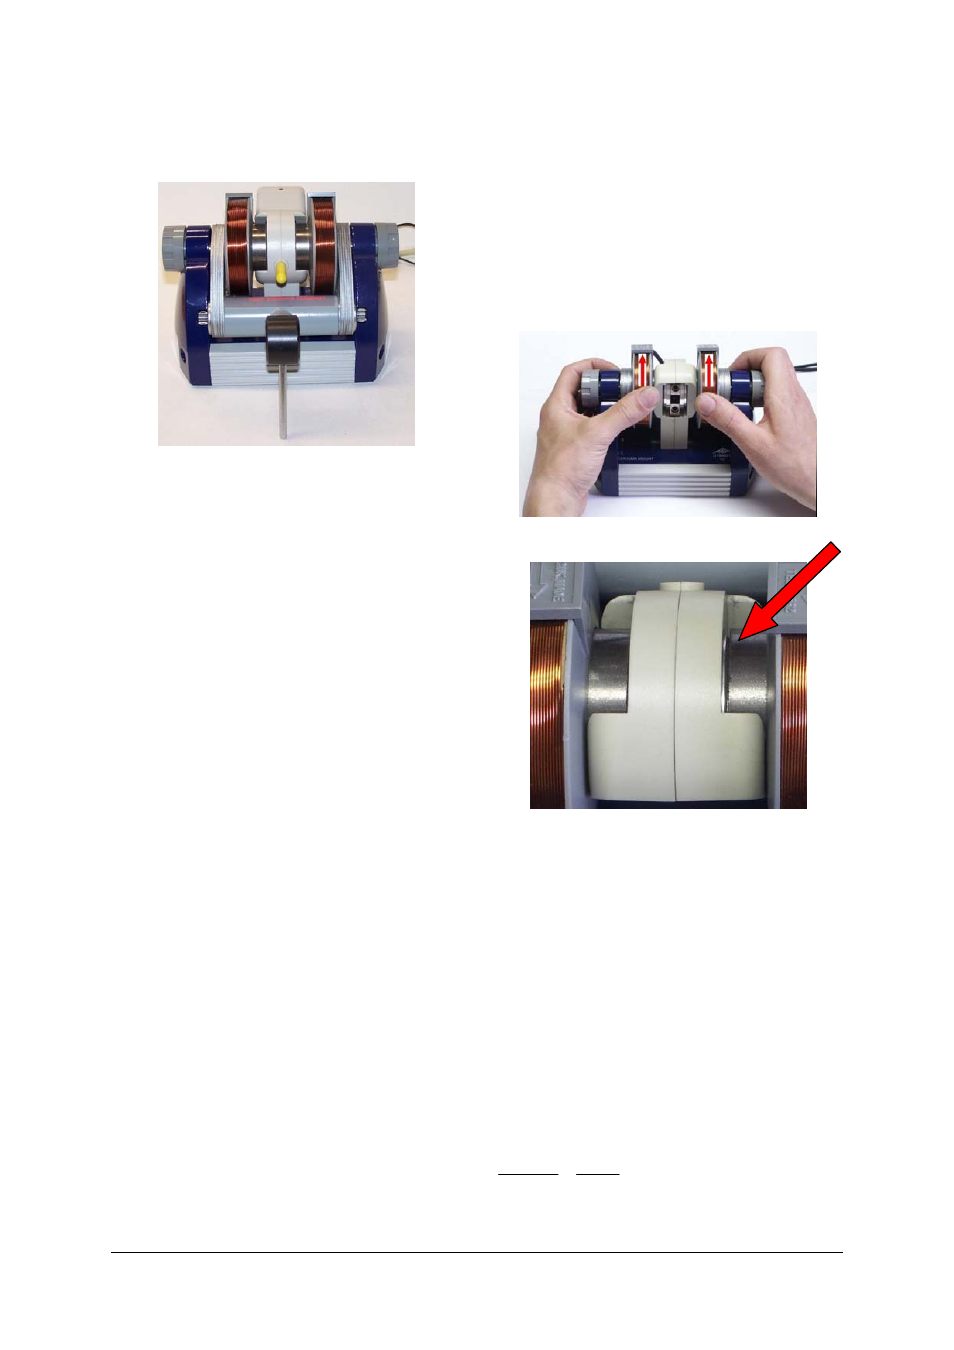
• Insert the glycerine sample (yellow top) into
the sample chamber (see Fig. 9).
Fig. 9 Basic unit with glycerine sample inserted
• Set a frequency of about 13 MHz on the
control console (since the frequency knob is
a 10-turn potentiometer, it may need to be
turned by multiple revolutions).
• Set the sensitivity to medium and adjust if
necessary.
At the optimum setting, the LED can be seen to
flicker slightly. If the LED lights up fully, the sig-
nal is overloaded.
• Carefully adjust the fine setting using the
frequency selector knob seeking out a peak
in the signal between about 1 ms to 1.5 ms
in width.
Note:
When looking for the peak, it can be helpful to
loosen the knurled screws a bit to change the
strength of the magnetic field and thus the sig-
nal. In order to optimise the signal refer to secti-
on 7.5.
• Vary the frequency to bring it to the middle
of the peak and write down what that fre-
quency is.
• Carry out the experiment again with different
material samples.
For the polystyrene sample (green top) the fre-
quency will be in the same range as for the
glycerine sample. For the Teflon sample (blue
top) the frequency will be lower (see Figs. 13 to
15).
Another experiment can be carried out in which
the stalk of a plant can be inserted into the sam-
ple chamber for its resonant frequency to be
determined.
7.5 Optimisation of signal
If the signal is fuzzy (width of signal > 2ms),
there are several ways it can be improved. The
basic requirement for this is that some kind of
signal, no matter how poor its quality, needs to
be obtained for the glycerine sample. The objec-
tive is to obtain a signal with a median width of 1
ms.
7.5.1
Use the two knurled screws to vary the
pressure on the assembly discs and observe the
signal as you do so. It may be necessary to
tighten the two screws to differing degrees.
7.5.2
Pull the probe out some of the way (up to
5 mm) and observe the signal.
7.5.3
Slightly loosen the two knurled screws and
move the magnets about 1 to 2 mm away from
their end positions. To do this, use your thumbs
to push back the two coils while resting your
fingers on the base unit (Fig. 10). Tighten the
knurled screws while observing the peak.
Fig. 10 Moving the magnets
Fig. 11 Magnet moved out of its end position
7.5.4
Slightly loosen the two knurled screws and
move the magnets about 1 to 2 mm away from
their end positions, then move them back to the
ends. In doing so, move the two discs a little
further forward. Tighten the knurled screws
while observing the peak.
7.6 Evaluation
Resonant frequencies of material samples
Glycerine (
1
H) 42.58
MHz/T
Polystyrene (
1
H) 42.58
MHz/T
Teflon (
19
F) 40.06
MHz/T
Plant stalk (
1
H) 42.58
MHz/T
The following therefore applies:
e
Polystyren
Glycerine
ν
=
ν
58
.
42
06
.
40
=
ν
ν
Glycerine
Teflon