Autovelocity™ dynamics and the dbx 160sl – dbx 160SWP User Manual
Page 5
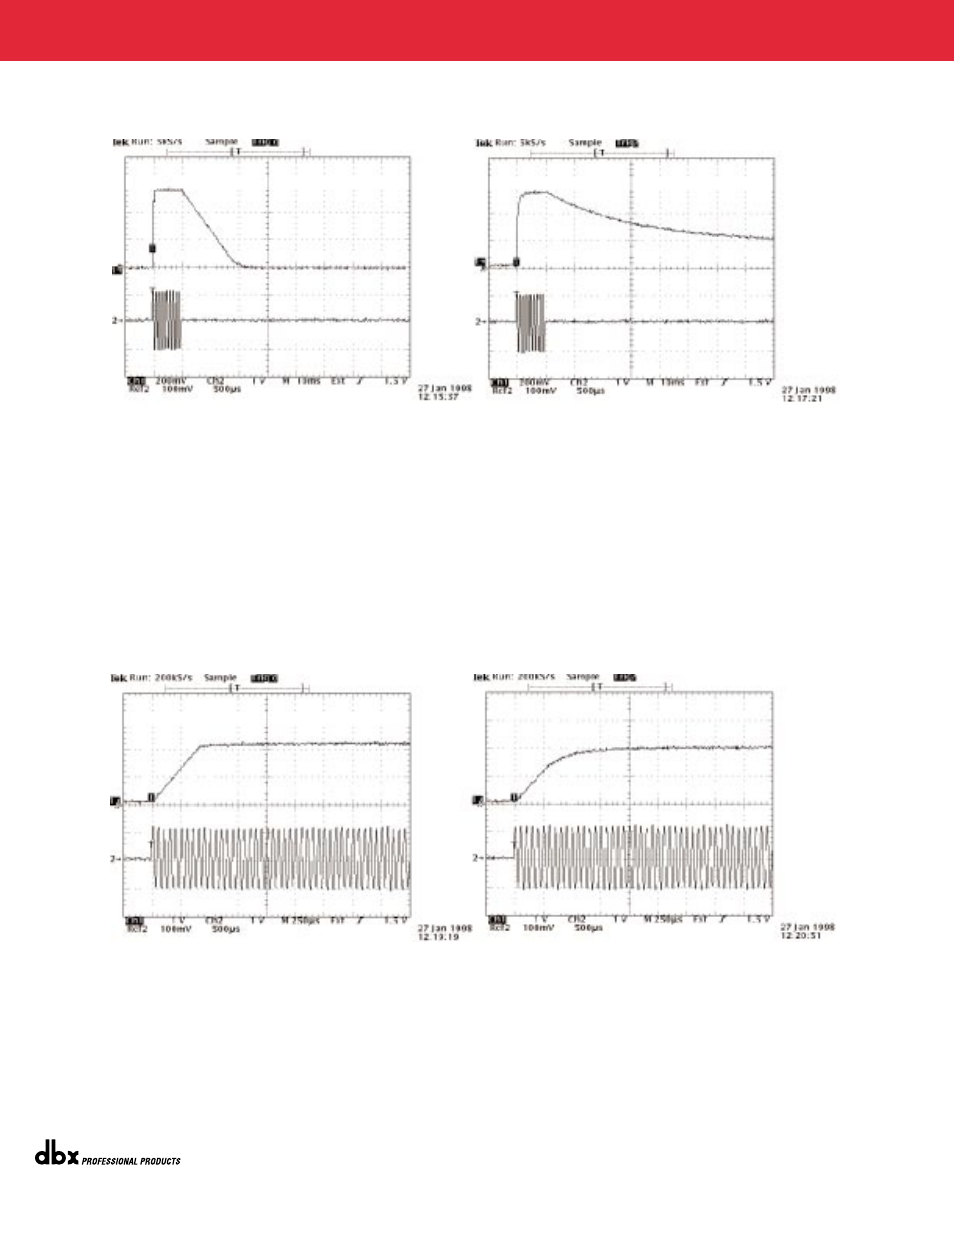
Figure 2. The graph on the left shows the small step release curve of the 160SL in response to a
sine wave burst input with AVD circuitry disengaged. The graph on the right shows the release
curve of the 160SL to the same burst input with AVD circuitry engaged. Note the slower release
time in the graph on the right.
Figure 3. The graph on the left shows the large step attack curve of the 160SL in response to a sine
wave burst input with AVD circuitry disengaged. The graph on the right shows the attack curve
of the 160SL to the same burst input with AVD circuitry engaged. Note the slope of the curves are
essentially the same.
AutoVelocityª Dynamics and the dbx 160SL White Paper - November 1998
Page 4
¨
AutoVelocity™ Dynamics and the dbx 160SL
See also other documents in the category dbx Audio accessories:
- AFS224 Manual (24 pages)
- 1066 (24 pages)
- 1046 (48 pages)
- 1046 (16 pages)
- db12 (2 pages)
- ZonePRO App Guide (4 pages)
- TR1616 (32 pages)
- DriveRack PA2 Complete Loudspeaker Management System (70 pages)
- DriveRack PA2 Quickstart Guide (2 pages)
- ZC-BOB (8 pages)
- 231s Equalizer (12 pages)
- PS6 (2 pages)
- ZonePRO 1260 (1 page)
- 234s Crossover (20 pages)
- 166xs (28 pages)
- PB48 (4 pages)
- DriveRack 220i (57 pages)
- DriveRack 260 (84 pages)
- DriveRack 4820 (96 pages)
- 376 (37 pages)
- iEQ15 (20 pages)
- ZC controller connectivity and association (1 page)
- Advanced Feedback Suppression AFS224 (11 pages)
- 162SL (31 pages)
- 266xs - Compressor/Gate (16 pages)
- ZonePRO 641m Digital Zone Processor (60 pages)
- DriveRack PX Quickstart Guide (24 pages)
- 1074 (16 pages)
- PX (48 pages)
- 2031 Equalizer (40 pages)
- 1231 Equalizer (44 pages)
- 286s (28 pages)
- 386 (35 pages)
- 160SL (32 pages)
- 120A (16 pages)
- db10 (2 pages)
- DriveRack PA+ Quickstart Guide (16 pages)
- ZonePRO 641m (1 page)
- 160A (20 pages)
- PMC16 (64 pages)
- DriveRack PA+ (40 pages)
- DriveRack VENU360 Loudspeaker Management System (127 pages)