Operation, Case front controls, Figure b.2.b - display – Lincoln Electric SQUARE WAVE TIG 255 SVM100-A User Manual
Page 20
B-7
OPERATION
SQUARE WAVE TIG 255
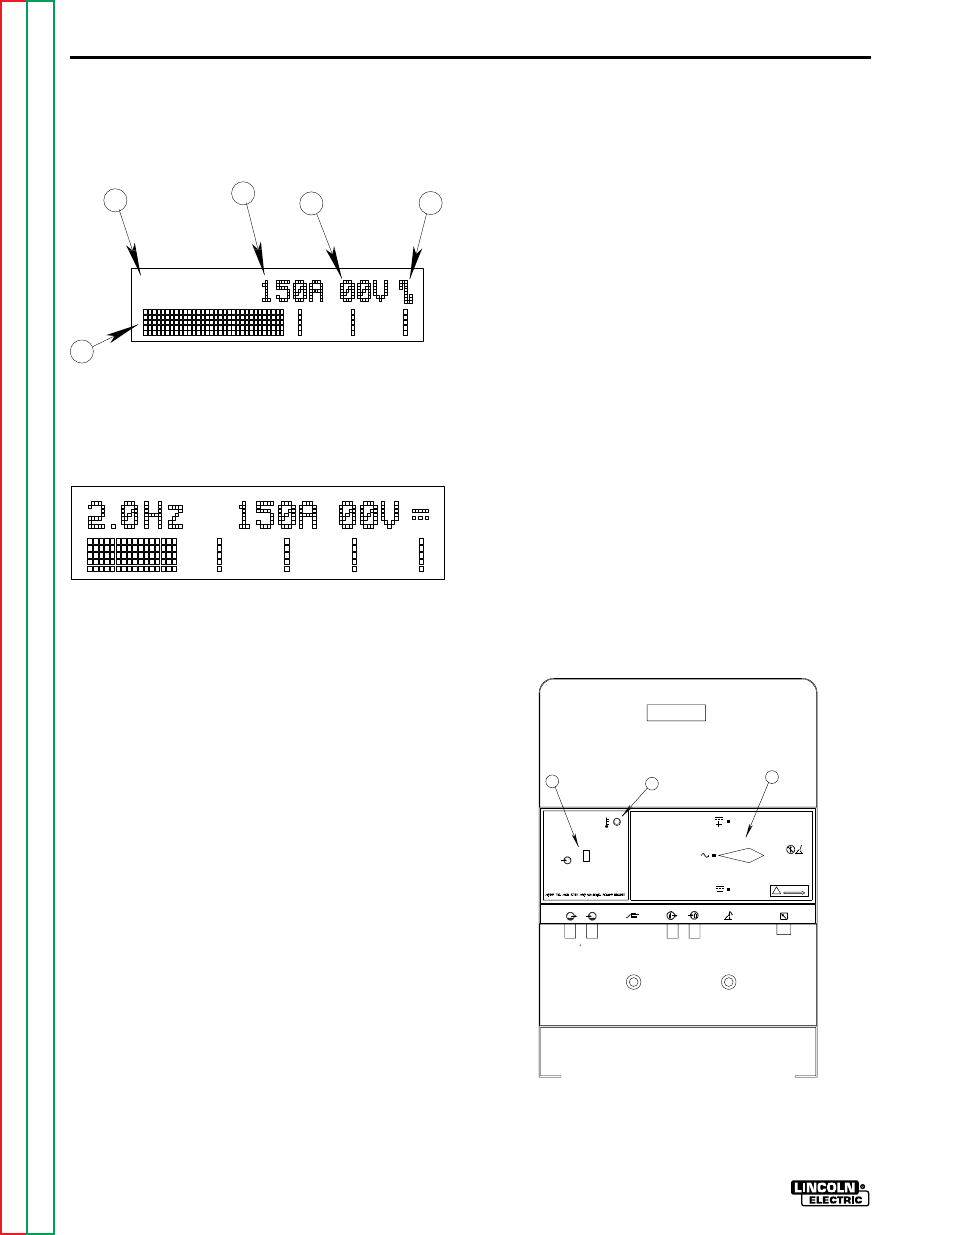
A. AC/DC INDICATOR: This symbol represents the
output polarity of the 255 . . . either AC or DC. AC
is shown in Figure B.2.a; DC is shown in Figure
B.2.b.
B. VOLTMETER: This meter displays open circuit
voltage as well as welding voltage, as measured
on the output studs of the Square Wave TIG 255.
C. AMMETER: The ammeter can display preset
current (for setting the welding current before
welding) and actual welding current (the value of
the welding current during a weld).
D. MOMENTARY DISPLAY: This area is blank under
most conditions; see Figure B.2.a. Different val-
ues may be displayed here as certain keypad
keys are pressed. See Figure B.2.b; the TIG
Pulser is being adjusted, so the Pulse Frequency,
2.0 Hz, is being displayed. Information in the
Momentary Display lasts for five seconds after a
key is pressed. Read the complete Operating
Instructions section for more information on the
values that appear in the Momentary Display.
E. BAR GRAPH DISPLAY: This area provides a
graphical display of values shown on the Ammeter
CASE FRONT CONTROLS
Refer to Figure B.3 for the location of the following
controls:
1.
POWER SWITCH: Controls the input power to the
Square Wave TIG 255.
2.
OVER TEMPERATURE LIGHT: A yellow light
which only lights when an over temperature
situation occurs. See the Maintenance Section for
more information on the thermostatic protection.
3.
POLARITY SWITCH: Selects DC+, AC or DC-
welding polarity. DO NOT SWITCH UNDER
LOAD.
7. CONTROL PANEL: The display is divided into five
sections. See Figures B.2.a and B.2.b.
FIGURE B.2.a - DISPLAY
A. AC/DC INDICATOR
D. MOMENTARY DISPLAY
B. VOLTMETER
E. BAR GRAPH
C. AMMETER
FIGURE B.2.b - DISPLAY
A
B
C
D
E
and on the Momentary Display. When the Momentary
Display is blank (as in Figure B.2.a), the Bar Graph
Display represents values shown on the ammeter.
When a low value is shown on the ammeter, only a
few “bars” will appear on the left hand side of the Bar
Graph Display. As the ammeter value increases, more
and more “bars” will appear. Whenever a value
increases, more and more “bars” will appear.
Whenever a value appears in the Momentary Display,
the Bar Graph Display will represent the Momentary
Display value, not the ammeter value.
FIGURE B.3 - CASE FRONT CONTROLS
1.
POWER SWITCH
2.
THERMOSTATIC
PROTECTION LIGHT
3.
POLARITY SWITCH
D C
D C
A C
O
I
P O W E R
W A R N I N G
E L E C T R O D E
W O R K
G A S
I N
O U T
W A T E R
I N
O U T
D O N O T S W I T C H
W H I L E W E L D I N G
L 9 1 1 9 - 1
L 9 1 1 9 - 2
R E M O T E
1
2
3