Mic button, Mic edit functions, Mic button mic edit functions – MACKIE QUAD EQ User Manual
Page 15: Owner’ s manual, Ref (mic reference level), Spl (db-spl weighting), Quad eq, Owner’s manual
14
QUAD EQ
Quad EQ
15
Owner’s Manual
Owner’
s Manual
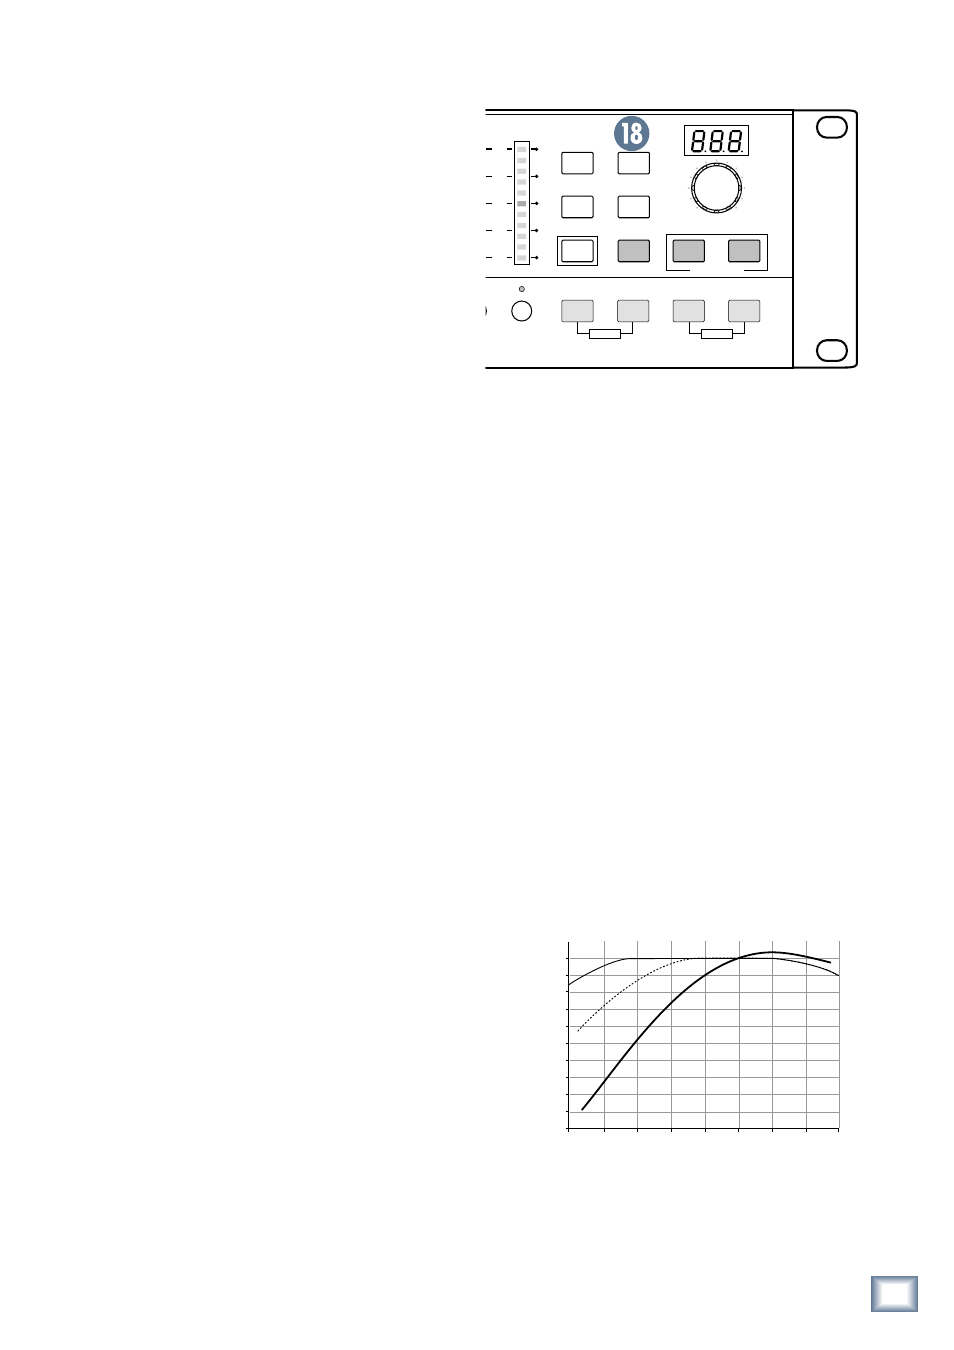
18. MIC button
Pressing this button will engage the measurement mi-
crophone input as the source for the analysis function,
and it will light the button solid.
The gain structure for this microphone input is set for
the included measurement microphone, and 48 V phan-
tom power is continuously applied to the input.
The RTA [17] and MIC buttons operate in an exclu-
sive manner, meaning only one of the two functions can
be active at any given time.
Engaging the MIC button also turns the DISPLAY [20]
into a dB-Sound Pressure Level (SPL) meter. It displays
“lo” when the received SPL is under 70 dB, and ranges
between 70 and 120 dB when the signal is present.
MIC EDIT functions
The MIC function has two edit functions:
1. Press EDIT [13] (blinks) and MIC (blinks) to
get to the first option (ref) in the DISPLAY. Use
the KNOB [19] to adjust its parameter.
2. Press MIC again to select the next option (SPL)
to be adjusted.
3. Press the KNOB or EDIT to exit the edit mode.
ref (MIC reference level)
This option allows you to adjust the MIC reference
level (–60 to 0 dB) with the KNOB to get the ana-
lyzed signal into the best range for viewing on the
LED ladders.
If you can see the SPL level reading, but there is no
display in the LED ladders, adjust this level to bring
it up from the depths and into view.
SPL (dB-SPL weighting)
This option allows you to choose A, B, or C weighting
for the SPL meter. Use the KNOB to scroll through
the 3 options.
“Weighting” is a curve of correction factors applied
across the frequency band to accommadate the per-
formance and perception of the human ear.
Generally, you can think of the A-weighting as a
correction for our perception at lower SPL levels,
B-weighing for medium levels, and C-weighting for
high levels.
A-weighting: Human beans can perceive loudness
more in the mid-range frequencies than the highs
or lows, so the A-weighting curve rolls off the highs
and lows. When noise levels are specified in hearing
protection ratings for example, these are usually A-
weighted, and commonly displayed as dBA.
B-weighting is similar to the A-weighting, only with
less attenuation of the lows and highs.
C-weighting is fairly flat, but with limited bandwidth.
It is often used to simulate what we perceive at high
decibel levels, and is commonly displayed as dBC.
You can switch between the settings, and gain some
insight into what is going on in your system. For
example, if a C-weighted SPL reading is much higher
than an A-weighted reading of the same system, then
there must be a fair amount of low-frequency energy
present (rolled-off more by the A-weighting than the
C). If the C and A-weighted SPL readings are similar,
then the main content must be in the mid-range.
Here is an approximate graph of the correction
curves applied to the measurements across the
frequency range.
���������
����
���������
���
�����
���
��
��
��
��
�����
����
����
�����
����
��
���
���
���
���
���
���
���
���
���
���
��
��
��
��
����
��
�
�
�
���
����
��
�
�
�
���
���
���
���
�
��
�
�������
�������
���������������������������
����
�����
���
���
������
������
������
�����
�
�
�
�
��������������
���
����
���
�����
���
��
��
��
��
�����
����
����
�����
����
��
���
���
���
���
���
���
���
���
���
���
��
��
��
��
����
��
������
������
��������������
��������������
��
�
��
���
���
���
���
���
���
���
���
��
���
���
���
���
���
���
����
�
�
�
����������������������