Showing sart marks on the radar display, General remarks on receiving sart – Furuno FR-1710 User Manual
Page 54
2-4
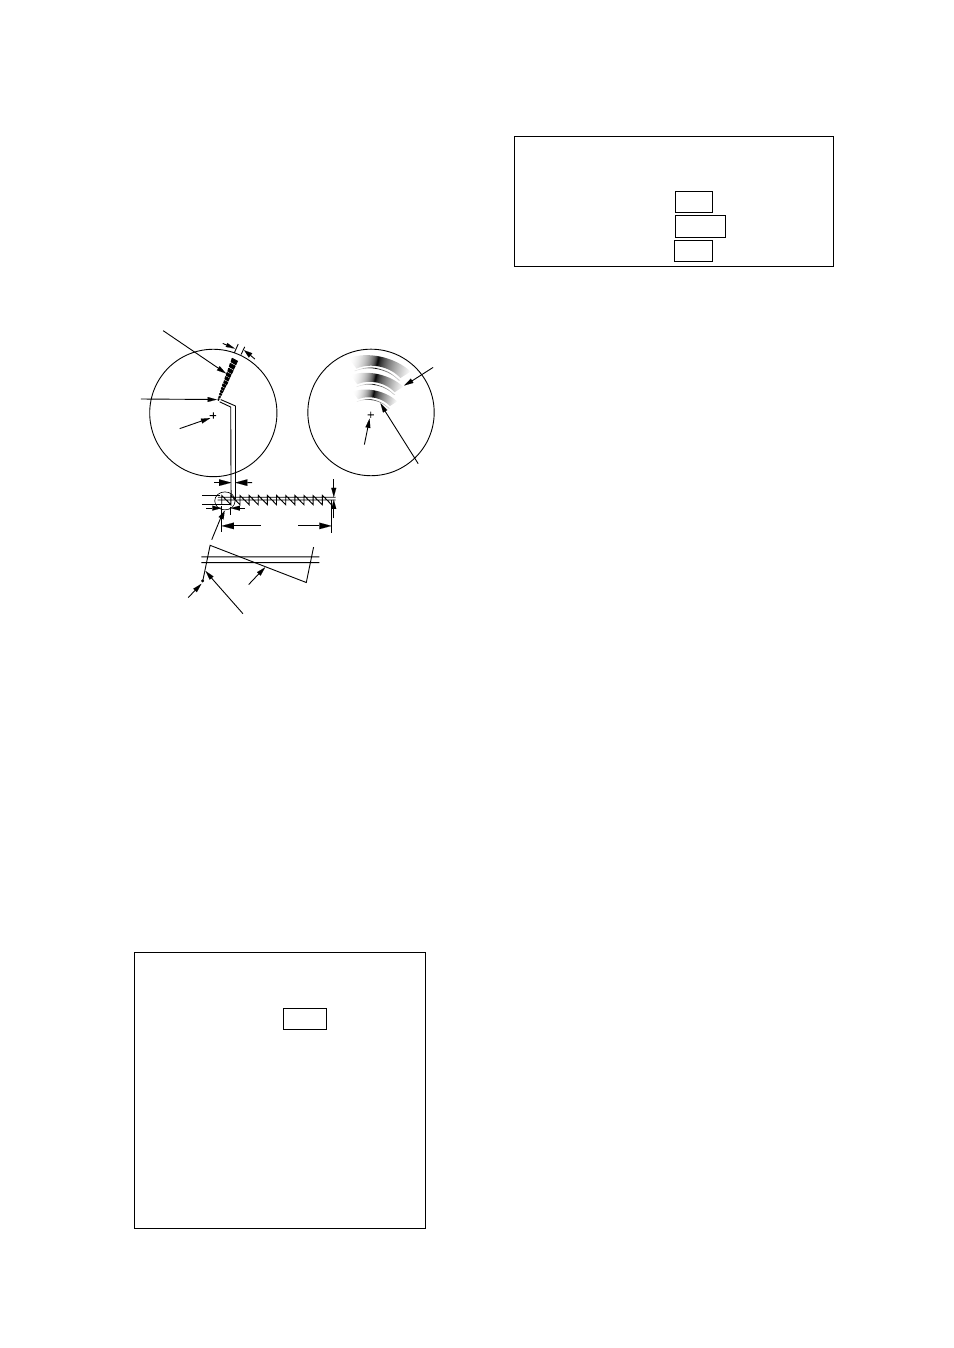
When the range to the SART is reduced to
about 1 nm, the radar display may show also
the 12 responses generated during the fast
sweeps. These additional dot responses,
which also are equally spaced by 0.64 nm,
will be interspersed with the original line of
12 dots. They will appear slightly weaker and
smaller than the original dots.
9500 MHz
9200 MHz
Radar antenna
beamwidth
Screen A: When SART
is distant
Screen B: When SART
is close
Lines of 12 dots
are displayed in
concentric arcs.
Echo of SART
Position of
SART
Own ship's
position
Own ship's
position
SART mark
length
Radar receiver
bandwidth
Sweep time
7.5
µ
s
95
µ
s
Sweep start
High speed sweep signal
Low speed sweep signal
24 NM
1.5 NM
Position of
SART
Echo of
SART
Figure 2-6 Appearance of SART signal on
the radar display
Showing SART marks on the radar
display
A range scale between 6 and 12 nm with nor-
mal radar settings should display SART sig-
nals. However, this radar has a special feature
which enhances the SART signals.
1. Detune the radar. Press the [MENU] key
followed by the [0] key twice to display the
OTHER menu.
1. HDG SET
2. SPD MODE
MAN LOG NAV
3. MAN SPD
4. DRIFT SET
5. DISPLAY
6. MARK/LINE
7. TUNE
8. NAV DATA
9. EBL/VRM
0.
↓
OTHER
Figure 2-7 OTHER menu
2. Press the [0] key twice.
3. Press the [5] key twice select DISPLAY.
DISPLAY
1.
↑
2. NAV DATA
OFF ON
3. DISPLAY
MAIN SUB
4. SART
OFF ON
Figure 2-8 DISPLAY menu
4. Press the [4] key several times to select
OFF or ON from the SART field as ap-
propriate.
5. Press the [ENTER/SELECT] key followed
by the [MENU] key.
When the SART function is turned on the
range is set to 12 nm, the noise rejector, echo
averaging, AUTO A/C and interference rejec-
tor are turned off, and SART is displayed at
the upper left-hand corner of the screen.
General remarks on receiving SART
SART range errors
When responses from only the 12 low fre-
quency sweeps are visible (when the SART
is at a range greater than about 1 nm), the
position at which the first dot is displayed may
be as much as 0.64 nm beyond the true po-
sition of the SART. When the range closes
so that the fast sweep responses are seen
also, the first of these will be no more than
150 meters beyond the true position.
Radar bandwidth
This is normally matched to the radar
pulselength and is usually switched with the
range scale and the associated pulselength.
Narrow bandwidths of 3-5 MHz are used with
long pulses on long range and wide band-
widths of 10-25 MHz with short pulses on
short ranges.
Any radar bandwidth of less than 5 MHz will
attenuate the SART signal slightly, so it is
preferable to use a medium bandwidth to
ensure optimum detection of the SART.