Application information, Calibration theory, Calibration with three measurements – Maxim Integrated 71M6533-DB User Manual
Page 35: Figure 2-1: watt meter with gain and phase errors, 2application information, 1 calibration theory, 1 calibration with three measurements
71M6533-
DB Demo Board User’s Manual
Page: 35 of 75
`
REV 3
2
APPLICATION INFORMATION
2.1 CALIBRATION THEORY
A typical meter has phase and gain errors as shown by
S
, A
XI
, and A
XV
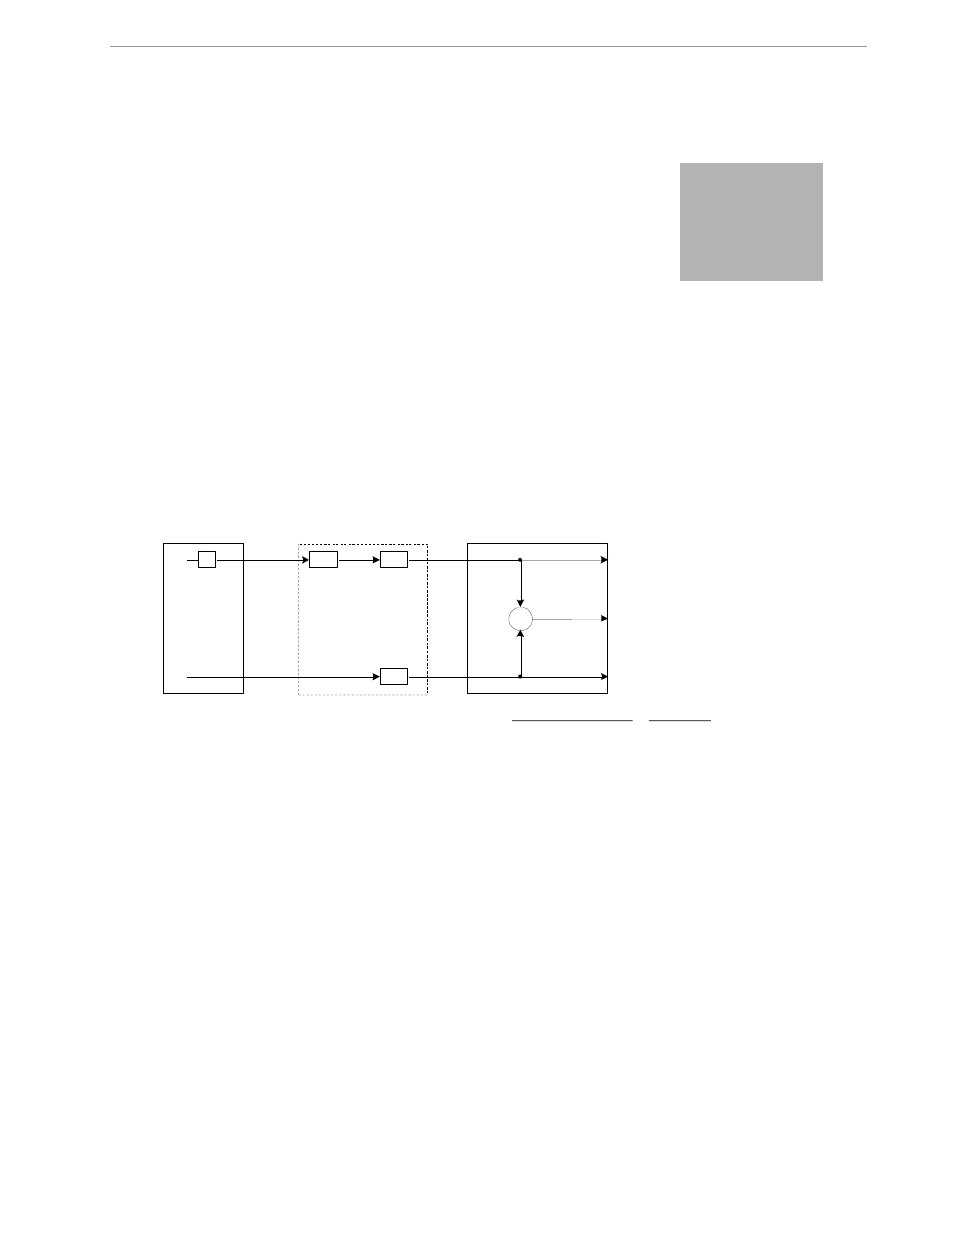
in Figure 2-1. Following the typical
meter convention of current phase being in the lag direction, the small amount of phase lead in a typical current
sensor is represented as -
S
. The errors shown in Figure 2-1 represent the sum of all gain and phase errors.
They include errors in voltage attenuators, current sensors, and in ADC gains. In other words, no errors are
made in the ‘input’ or ‘meter’ boxes.
I
V
L
INPUT
S
A
XI
A
XV
ERRORS
)
cos(
L
IV
IDEAL
)
cos(
S
L
XV
XI
A
A
IV
ACTUAL
1
IDEAL
ACTUAL
IDEAL
IDEAL
ACTUAL
ERROR
W
I
RMS
METER
V
RMS
XI
A
I
ACTUAL
I
IDEAL
,
XV
A
V
ACTUAL
V
IDEAL
,
L
is phase lag
S
is phase lead
Figure 2-1: Watt Meter with Gain and Phase Errors.
During the calibration phase, we measure errors and then introduce correction factors to nullify their effect. With
three unknowns to determine, we must make at least three measurements. If we make more measurements, we
can average the results.
2.1.1 CALIBRATION WITH THREE MEASUREMENTS
The simplest calibration method is to make three measurements. Typically, a voltage measurement and two
Watt-hour (Wh) measurements are made. A voltage display can be obtained for test purposes via the command
>MR2.1 in the serial interface.
Let’s say the voltage measurement has the error E
V
and the two Wh measurements have errors E
0
and E
60
,
where E
0
is measured with
L
= 0 and E
60
is measured with
L
= 60. These values should be simple ratios
—not
percentage values. They should be zero when the meter is accurate and negative when the meter runs slow.
The fundamental frequency is f
0
. T is equal to 1/f
S
, where f
S
is the sample frequency (2560.62Hz). Set all
calibration factors to nominal: CAL_IA = 16384, CAL_VA = 16384, PHADJA = 0.
2