Host adapter inventory widget – Brocade Network Advisor IP User Manual v12.3.0 User Manual
Page 281
Brocade Network Advisor IP User Manual
227
53-1003153-01
Dashboard customization
7
•
Widget summary — The product count for each status (worst to best order) with the associated
icon displays underneath the widget title.
•
Show Syslog check box — Select to include Syslog information (default) on the Event Summary.
•
Bar chart — The event severity using the color-codes in
The Events widget only includes events from products that are in your AOR. Double-click a bar
in the graph to navigate to the Events page with only the selected event type (Emergency, Alert,
and so on) displaying. For example, double-click the Error event bar. The Events page displays
with only Error events in the table. Fore more information about the Events page, refer to
The x-axis represents the number of occurrences of a particular event severity during the
selected time period. If you pause on a bar, a tooltip shows the number of events with that
severity level during the selected time period. Also, for each severity, the cumulative number of
traps, application events, and security events is reported next to the horizontal bar. If Syslog
messages are included, then they are included in the count. To conserve space, the number is
shown as is or truncated to the nearest 1,000("K") or 1,000,000("M").
By default, Syslog events are included in the summary; however, because Syslog events occur
at a much higher frequency than other events and therefore could skew the bars for the other
events, you can exclude Syslog events. If they are excluded, they will not be displayed in the
legend. Users’ selections are persisted (per user per server).
Customizing the Events widget
You can customize the Events widget to include Syslog information (default) on the Event Summary
pane by selecting the Show Syslog check box.
To exclude Syslog information, clear the Show Syslog check box.
Accessing additional data from the Events widget
Double-click a bar in the graph to navigate to the Events page with only the selected event type
(Emergency, Alert, and so on) displaying. For example, double-click the Error event bar. The Events
page displays with only Error events in the table. Fore more information about the Events page,
refer to
Host Adapter Inventory widget
The Host Adapter Inventory widget displays the host adapter products inventory as stacked bar
graphs.
The Host Adapter Inventory widget includes the following data:
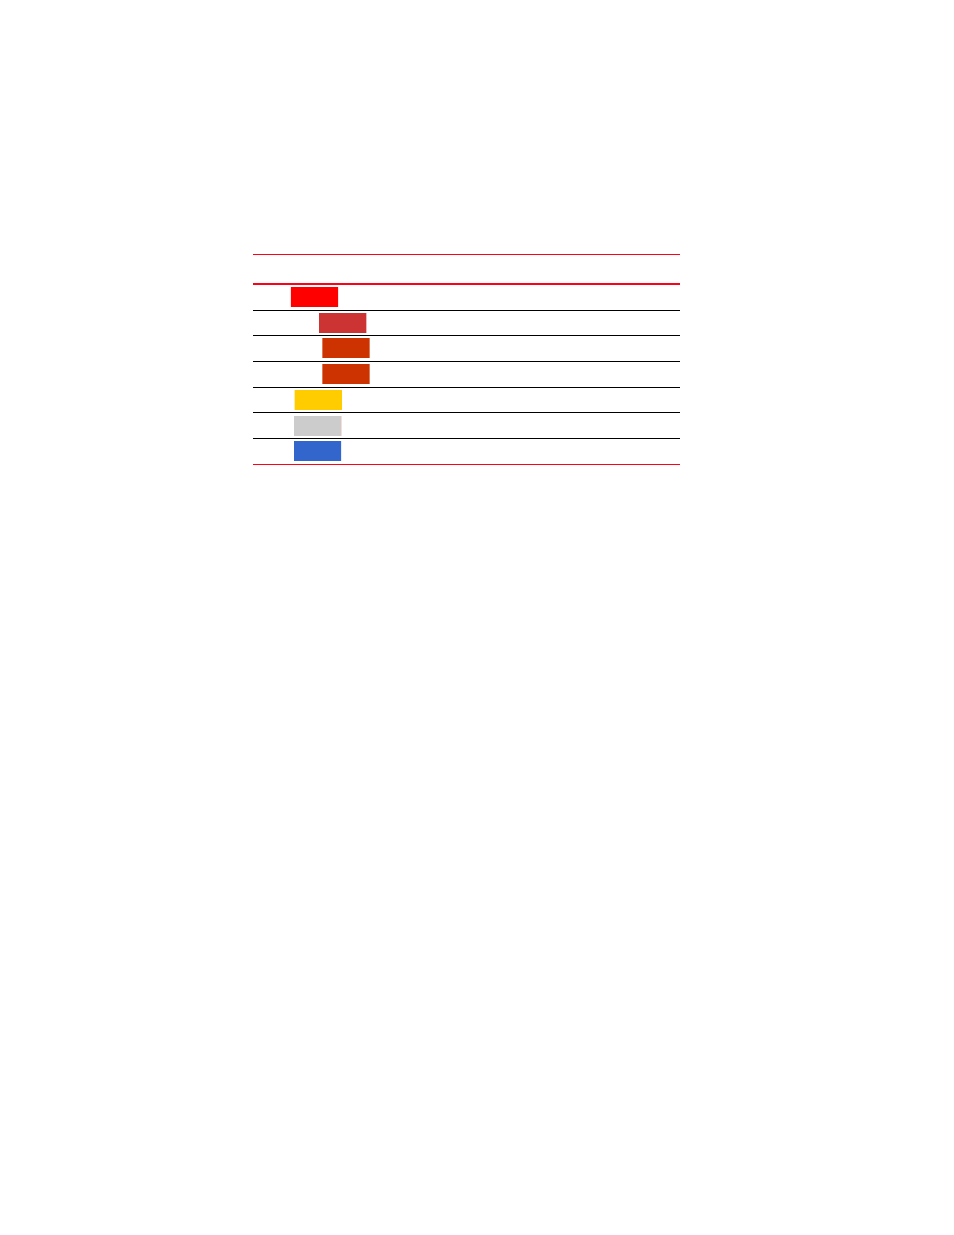
TABLE 21
Event severity color codes
Color
Severity
Red
(
)
Emergency
Brick Red
(
)
Alert
Brick Red
(
)
Critical
Brick Red
(
)
Error
Gold
(
)
Warning
Grey
(
)
Notice
Blue
(
)
Info