Brocade Network Advisor IP User Manual v12.3.0 User Manual
Page 1175
Brocade Network Advisor IP User Manual
1123
53-1003153-01
IP real-time performance monitoring
34
•
Use logarithmic axis check box — Data can be presented on a logarithmic or
non-logarithmic axis. Each unit in a non-logarithmic axis presents the data in equal
segments. However, logarithmic axis units are not equal and can increase exponentially by
10. Therefore, use a logarithmic axis if you have a large amount of data to view.
•
Show values check box — Annotates data point values in the graph.
•
Enable automatic scrolling check box — If new data is collected while the chart is in view,
the chart will automatically jump to display the new data.
•
Enable transition effect check box — The SNMP monitoring chart automatically adjusts the
range on the vertical axis so that all the data are contained within the view area when you
drag the chart into a different time range. Enabling this option provides an animated
smooth transition between the adjustments while the monitoring chart is being dragged or
during any action that may cause the range of vertical axis to change.
•
Show Threshold/Rearm — Displays threshold and rearm events on the chart.
•
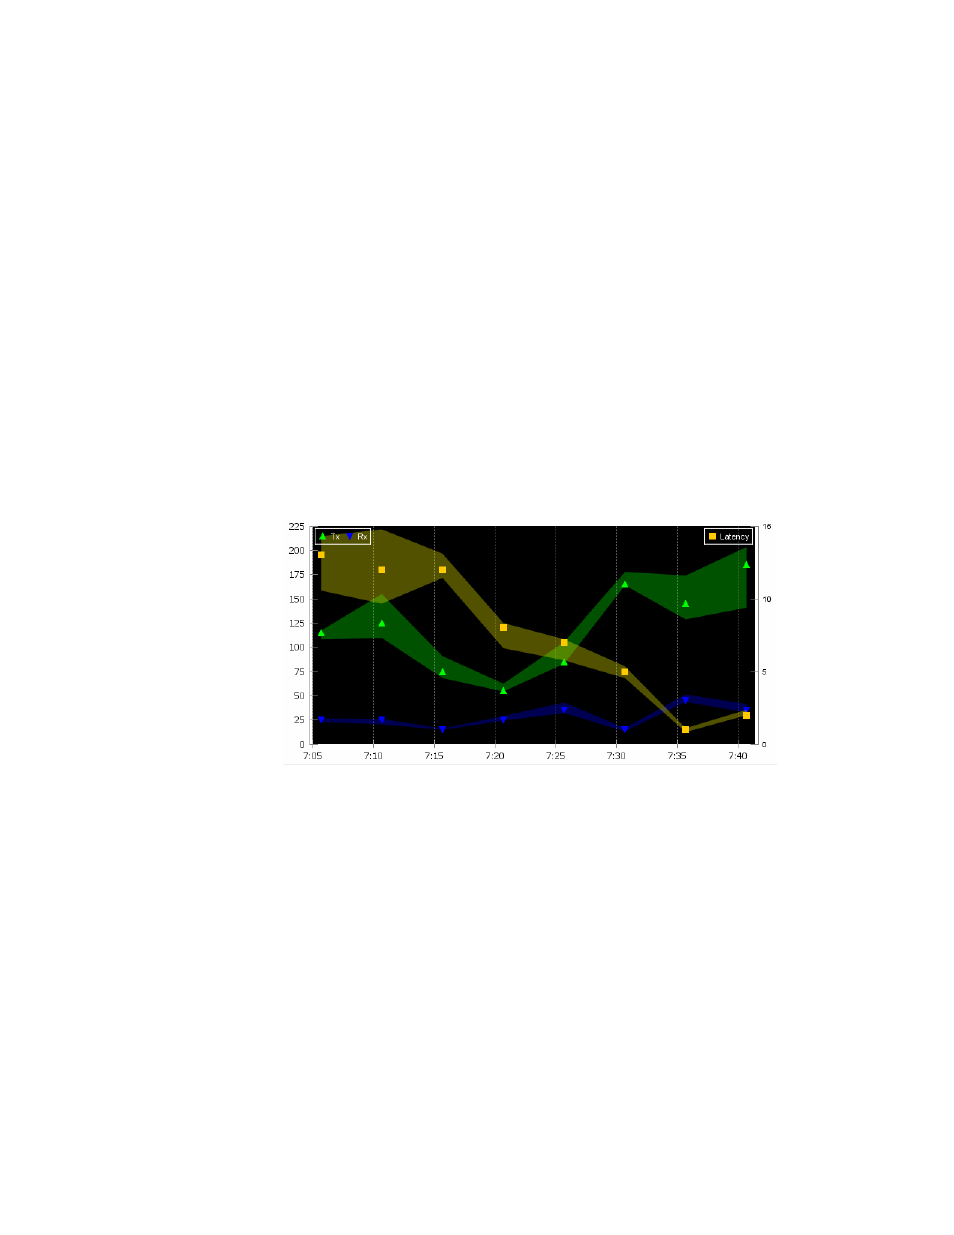
(Historical graphs and monitors only) Plot Min/Max - Plots minimum and maximum values
along with the average data. The range between the minimum and maximum values will
be represented by the width of a color band surrounding the data points as shown in the
following illustration. Note that this option is not available if you select Minimum Interval
granularity. It also does not apply and is not available for real-time performance graphs.
FIGURE 468
Data points graph
•
Show events - Select to display advanced monitoring service (AMS) violation events
received during the chart time range and master log events logged on the same product as
the measure being plotted. Each event will be represented by the same severity icon that
is shown in the master log (refer to the icons at the bottom of the following graph). Pausing
the pointer over the icon displays details of the violation, such as violation time,
switch/port information, violated rule name, and violated rule condition. Monitoring and
Alerting Policy Suite (MAPS) violations are plotted for a product or port level measure
(whichever is selected) during the plotted time range. The show events graph is shown in