Using the legend 3000 series – Humminbird Legend 3000 User Manual
Page 7
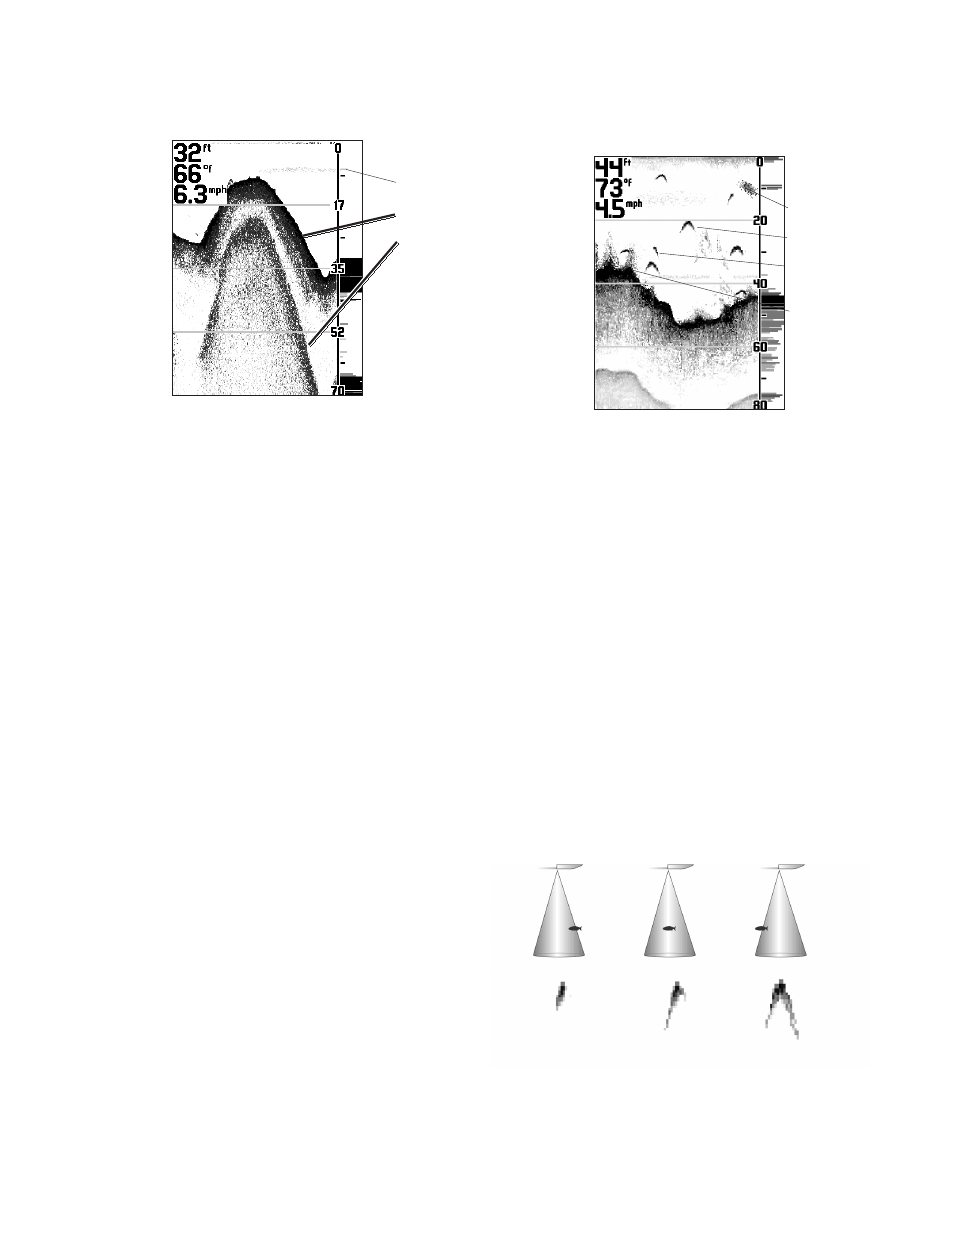
Thermoclines
The
L
EGEND
3000 S
ERIES
is also capable of showing layers
of water having different temperatures. These
temperature differences, called thermoclines, appear
at different depths, depending on current conditions.
A thermocline typically appears as a continuous band
of many gray levels moving across the display at the
same depth. Thermoclines always appear above the
bottom.
Fish Appearance
Schools of bait fish as well as individual fish are clearly
visible on the
L
EGEND
3000 S
ERIES
display. Bait fish appear
as “clouds” having different shapes and sizes
depending on the number of fish and boat speed.
Individual fish appear as smaller black and gray lines,
often appearing as a “fish arch.” A fish arch may form
as the fish moves through the sonar beam. Due to the
transducer beam angle, the distance to the fish
decreases as the fish moves into the beam, and then
increases as it moves out again. When the C
HART
W
INDOW
graphs this distance change, an arch
appears. Boat speed, the C
HART
S
PEED
setting and
movement of the fish greatly affect the shape of the
arch. When the boat and the fish are moving slowly
relative to each other, the fish creates an elongated
arch. When the boat and the fish are moving quickly
relative to each other, the fish creates a shorter arch.
A partial arch forms when the fish does not move
through the entire cone angle.
Note: It
i
s
important to remember that sonar cannot distinguish between
a fish and some other object suspended in the water.
Regardless of the object the sonar detects, it has the
possibility of being drawn as an arch.
Sonar Views (Deep Models Only)
The dual beam (50/200kHz) sonar information can be
displayed in several different views in the
C
HART
W
INDOW
. In the
200kHz view, only the sonar returns and
F
ISH
ID
from the
200kHz beam are displayed. Typically, the 200kHz
information provides greater bottom detail up to 800' and
works well while the boat is in motion. The 50kHz view only
shows the sonar returns and
F
ISH
ID
from the 50kHz beam.
The 50kHz information provides depth accuracy up to 2000'
and shows more targets in its wider beam. The Split Screen
view shows the 50kHz and 200kHz sonar information in
side-by-side windows on the display. The 200kHz/50kHz
view is a composite of the 200kHz sonar information and
the target information from the 50kHz sonar. See
CONTROL
PANELS
for details on selecting the sonar views.
5
USING THE LEGEND 3000 SERIES
CHART WINDOW / BOTTOMS / FISH APPEARANCE
Fish Arch Diagram
Thermocline
Slope
Second
Return
Bait fish
Fish Arch
Partial Fish
Arch
Structure