Using the legend 3000 series – Humminbird Legend 3000 User Manual
Page 6
The sonar returns received by the
L
EGEND
3000 S
ERIES
are
displayed along the depth range scale in a
R
EAL
T
IME
S
ONAR
™ (RTS) W
INDOW
and
C
HART
W
INDOW
. The
RTS W
INDOW
displays new sonar information within the transducer
cone in an expanded, easy-to-see format; the
C
HART
W
INDOW
logs old
RTS W
INDOW
information to show a contour
view of the bottom and structure.
Real Time Sonar™ (RTS)
Window
Real Time Sonar (RTS)
Window
The R
EAL
T
IME
S
ONAR
(RTS)
W
INDOW
shows instantaneous
sonar returns from the bottom,
structure and fish that are within
the transducer beam. The RTS
W
INDOW
updates with new sonar
information up to 30 times per
second in shallow water (deeper
water will slow the refresh rates).
The RTS W
INDOW
responds to
quickly-changing depths in a
way similar to a flasher type
sonar display. Interpreting
the RTS information requires
some skill; comparing the
RTS data with the data in
the C
HART
W
INDOW
, however,
makes the RTS information
easy to understand.
The width of the RTS W
INDOW
can be adjusted to your
preference. Selecting a
wider RTS W
INDOW
shows
greater differences between the strength of the sonar returns, although
doing this will reduce the amount of history on the display. See C
ONTROL
P
ANELS
for details on adjusting the RTS W
INDOW
.
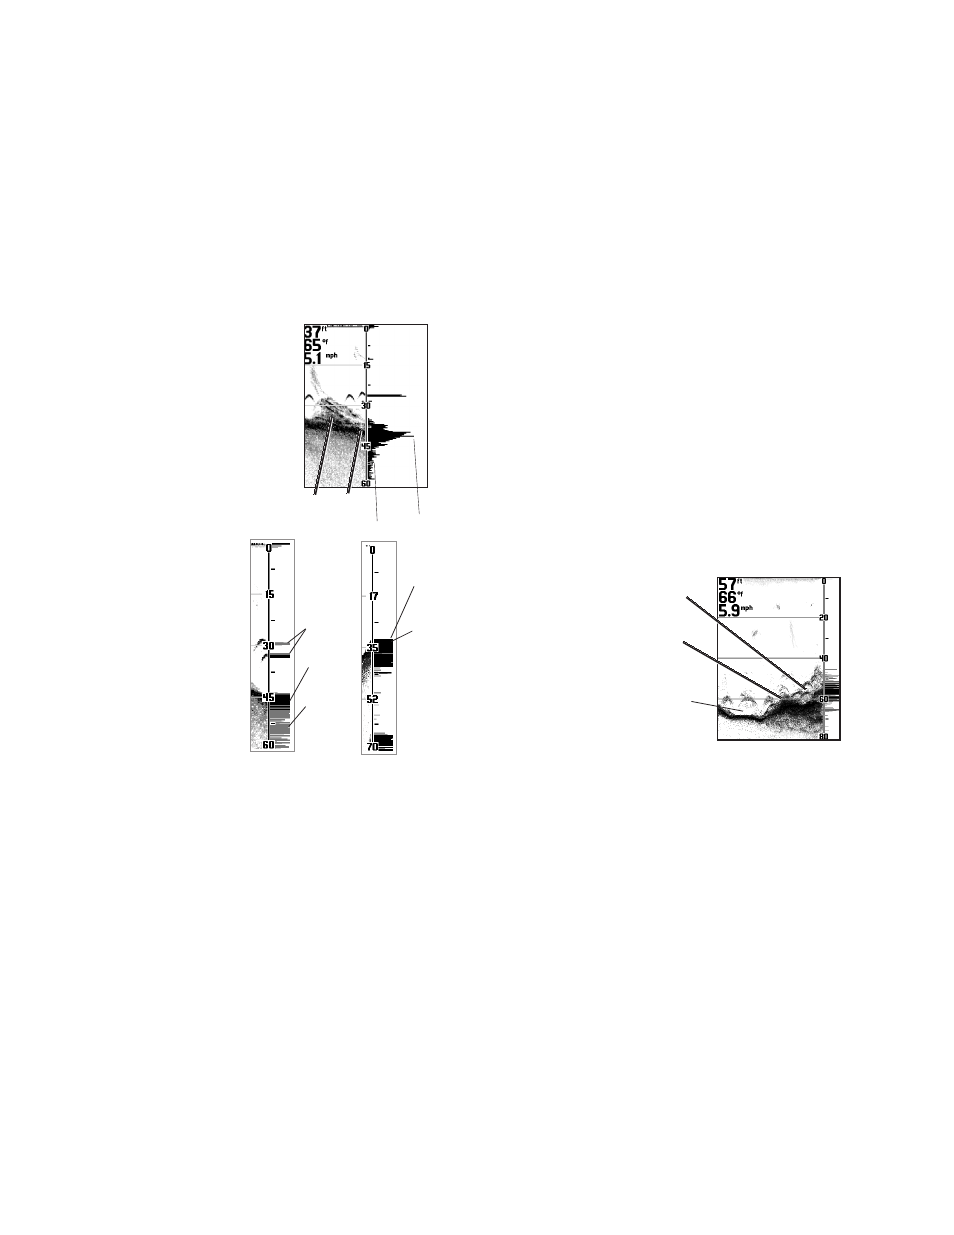
When the RTS W
INDOW
is wide enough, it plots the depth and intensity
(amplitude) of a sonar return using horizontal black lines, where line length
indicates return strength, and the vertical placement of the lines next to the
depth range scale indicates the depth.
When the RTS W
INDOW
is narrow enough, it plots the depth and intensity of a
sonar return using grayscale lines, where the intensity of the sonar return is
divided into 16 levels of grayscale, with the most intense returns shown in
black, and less intense sonar returns shown as progressively lighter shades
of gray. When the view is narrow enough, the combination of the grouping of
the lines and the grayscale level helps to identify the bottom composition and
structure. The bottom displays as the largest grouping of black horizontal
lines, and typically has gray lines underneath. A harder bottom shows less
gray below; a soft bottom shows more gray below. Structure appears above
the bottom as a cluster of lines with varying lengths and gray shades.
In any view, fish appear as smaller groupings of sonar returns between the
bottom and surface. Often, large fish within a structure will show as a strong
return within a grouping of smaller returns. When the boat is stationary or
drifting very slowly, the RTS W
INDOW
can show the movement of the fish
through the transducer beam. Moving fish appear as smaller groups of lines
that become progressively larger lines, or vice versa. A grouping of lines
moving vertically indicates a fish changing depth.
The Chart Window
The C
HART
W
INDOW
creates a historical log of sonar returns from stored RTS
information. As the boat moves, variations in the depth and sonar return changes are
charted to form an image of the bottom contour. The most recent sonar returns are
charted on the right side of the window; as new information is received, the older
information is moved across the display.
The C
HART
W
INDOW
also indicates the composition of the bottom. A hard bottom,
such as compacted sediment or flat rock, appears as a dark, thin line across the
display. A soft bottom, such as mud or sand, appears as a thicker line that
contains a transition from darker to lighter grays. Bottoms made up of many rocks
have a broken, random appearance.
Sloped Bottoms
Bottoms having a large degree of slope also present a unique picture. These
generally have a thicker black band representing the bottom directly under the boat.
Equal areas of gray above and below the black band represent sonar returns from
around the boat.
Second Sonar Returns
A second sonar return may be
visible if the appropriate depth
range is selected. This appears as a
depth contour below the main
bottom contour, at twice the depth.
The second return occurs when the
sonar signal bounces between the
bottom and the surface of the
water, then back again. Some
anglers use the appearance of the
second return to determine bottom
hardness. With a lower gain setting
the second return will be more faint,
except in areas with a hard
bottom.
The
L
EGEND
3000 S
ERIES
has a unique depth range
feature which permits the second return to be visible
in any depth range up to one-half the maximum depth
of the unit. See
M
ODES OF
O
PERATION
for details.
Structure
The
L
EGEND
3000 S
ERIES
displays structure, such as
submerged grass, brush, trees and wrecks on the
bottom. Structure can be distinguished by comparing
the area just above and below the main bottom return.
Usually structure shows as areas of dark to light gray
on top of a dark bottom contour. The appearance of
structure is greatly affected by boat speed and
direction; to repeat the same image it is often
necessary to travel the same speed and direction over
the location where the structure was originally
located.
4
USING THE LEGEND 3000 SERIES
REAL TIME SONAR™ / CHART WINDOW
Intense
returns
Hard
Bottom
Fish
Soft
Bottom
Less
intense
returns
Structure
Bottom
Less intense returns
Intense returns
RTS Wide “A” scope mode
Chart Window
Rocky
Bottom
Soft
Bottom
Hard
Bottom