20
Track One
Measurements
Compressor/Limiter, LMF
A
C
B
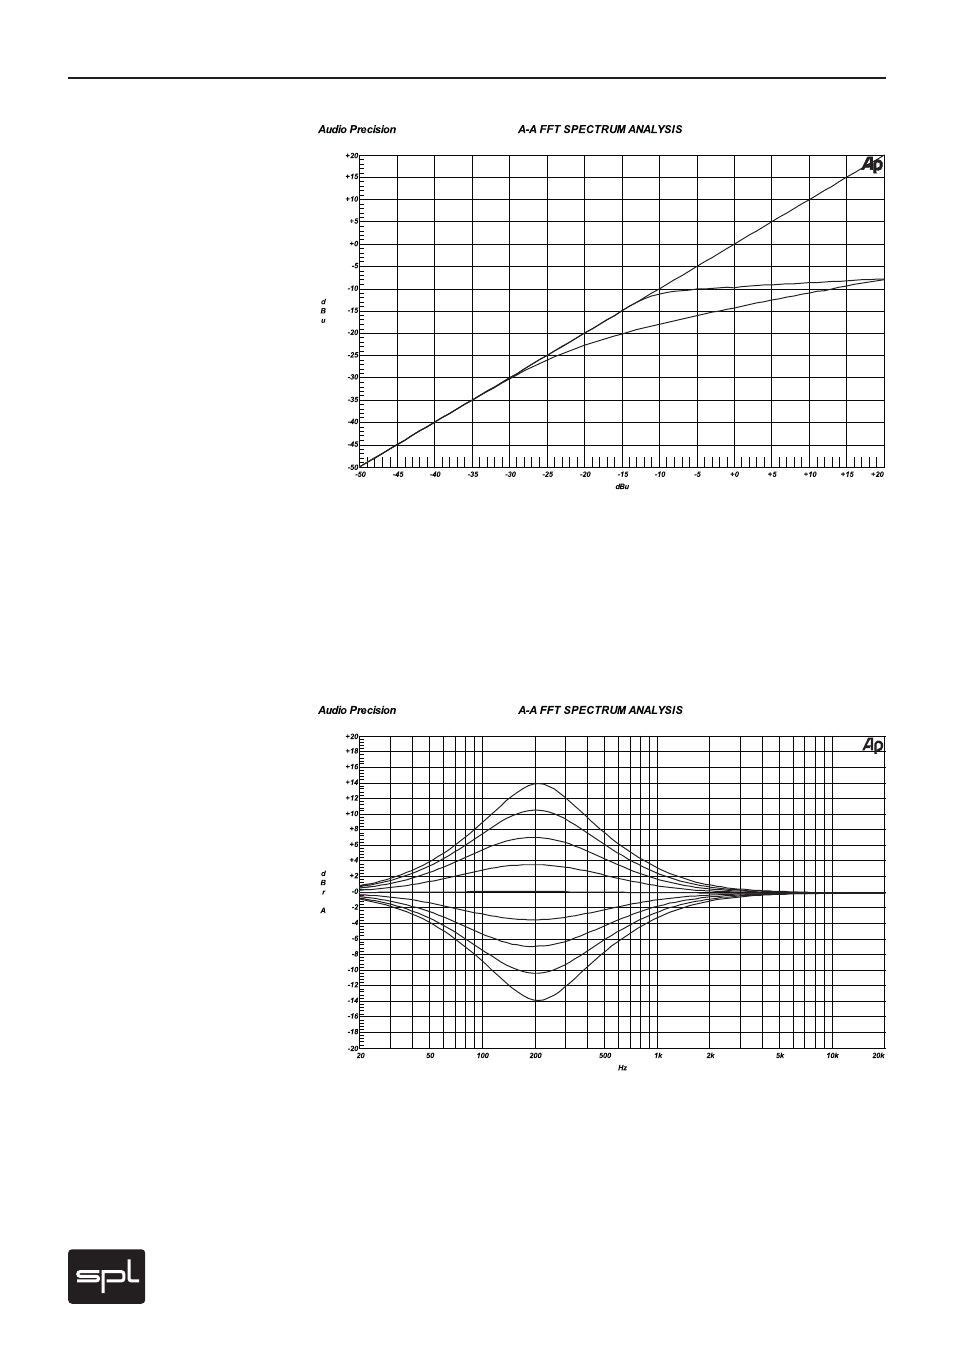
Diagram 1: compressor curves
Line A displays the ratio between
input and output
Line B shows the curve character-
istics of the compressor
Line C protrays the limiter‘s curve
characteristics
Diagram 2:
various LMF settings
around 200 Hz