Nortec NHSC Nortec OnLine User Manual
Page 10

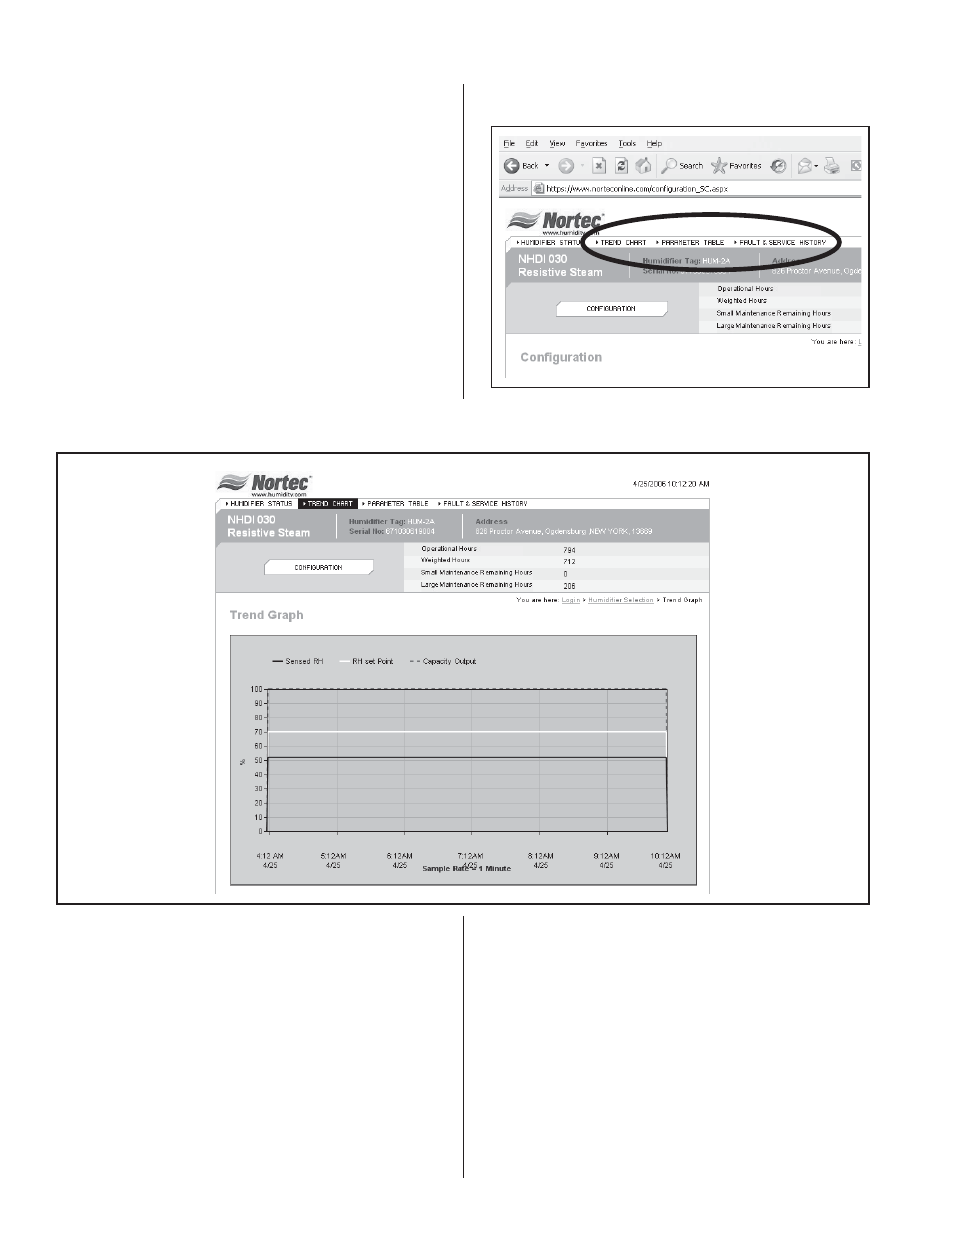
At the top of the screen the user is presented with
options for three different screens (see Figure #9).
One option will provide a trending graph (See
Figure #10) that monitors points such as
%RH/Demand and setpoint settings for channel 1 and
channel 2 as well as the current humidifier’s output.
This trend graph is capable of keeping historical data
for each particular unit.
The Fault and Service History link (See Figure
#11) provides a list of up to 18 fault or service errors
that the humidifier has experienced
.
This can provide
valuable troubleshooting information when faced with
a recurring problem.
The Parameter link (See Figure #12) provides an
in-depth view of all the variables available through
Nortec OnLine. From the parameter listings a user can
determine if the proportional coefficient for the PI band
on channel 1, or even what version of software the unit
is currently operating with.
- 8 -
Figure #9
Three Screen Options
Figure #10
Trend Data
