Eq and filter response graphs – Coda Audio C5 User Manual
Page 27
27
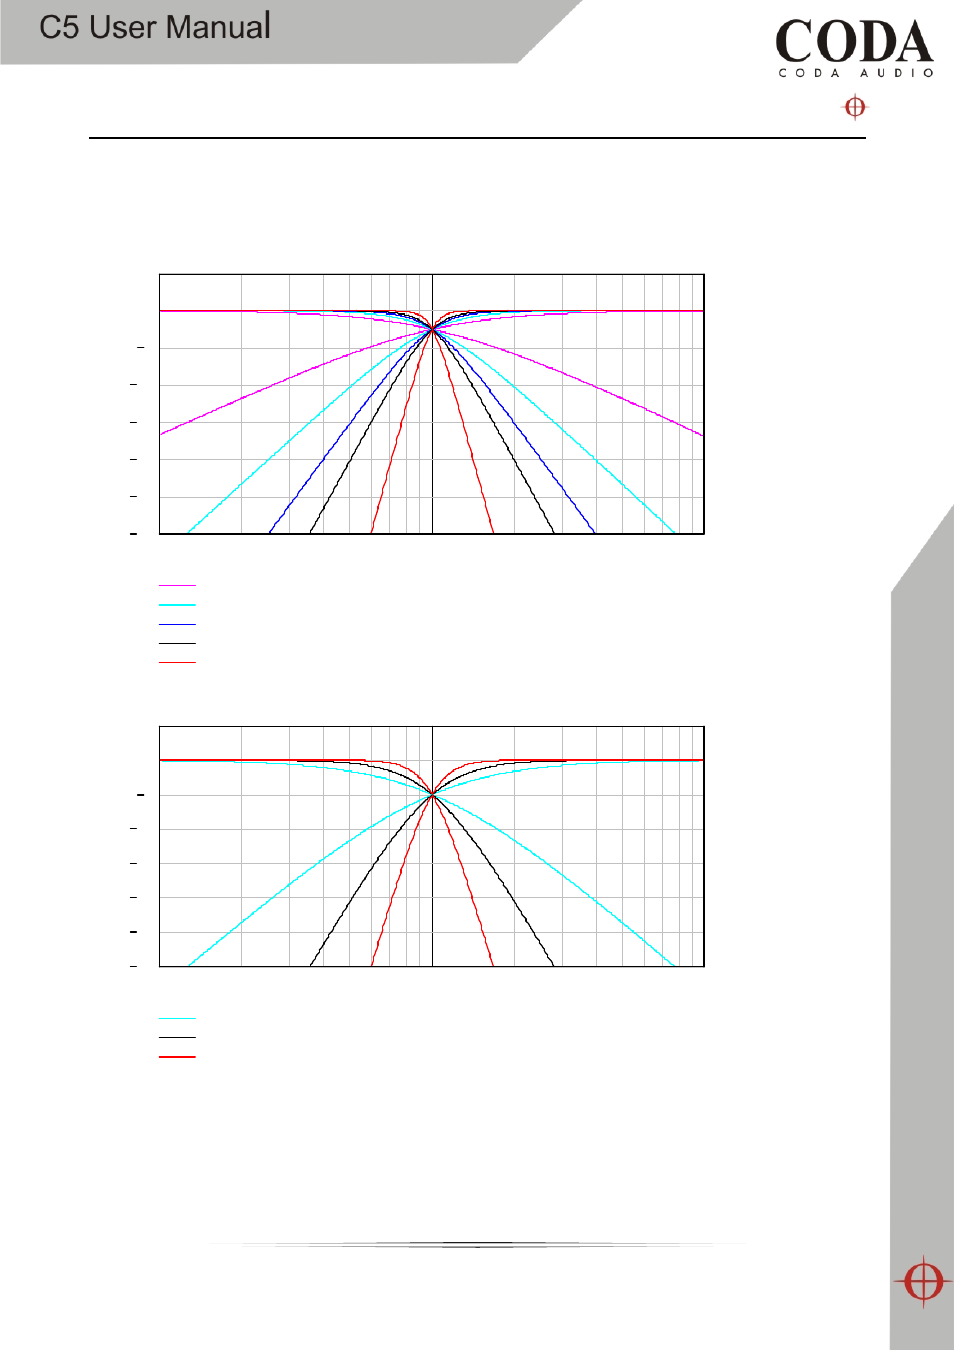
EQ and Filter Response Graphs
The following plots show the attenuation characteristics of the various crossover filters
available within the C5. These are all shown at a crossover frequency of 1kHz.
100
1
.
10
3
1
.
10
4
36
30
24
18
12
6
0
6
6dB/Oct
12dB/Oct
18dB/Oct
24dB/Oct
48dB/Oct
Butterworth
Frequency, Hz
M
a
g
n
it
u
d
e
,
d
B
100
1
.
10
3
1
.
10
4
36
30
24
18
12
6
0
6
12dB/Oct
24dB/Oct
48dB/Oct
Linkwitz-Riley
Frequency, Hz
M
a
g
n
it
u
d
e
,
d
B
This manual is related to the following products: