Intek RheoVac 950 User Manual
Page 28
- A4 -
I:\OFFICE\WPMANUAL\RV950 APPENDIX A3.wpd
January 29, 2007
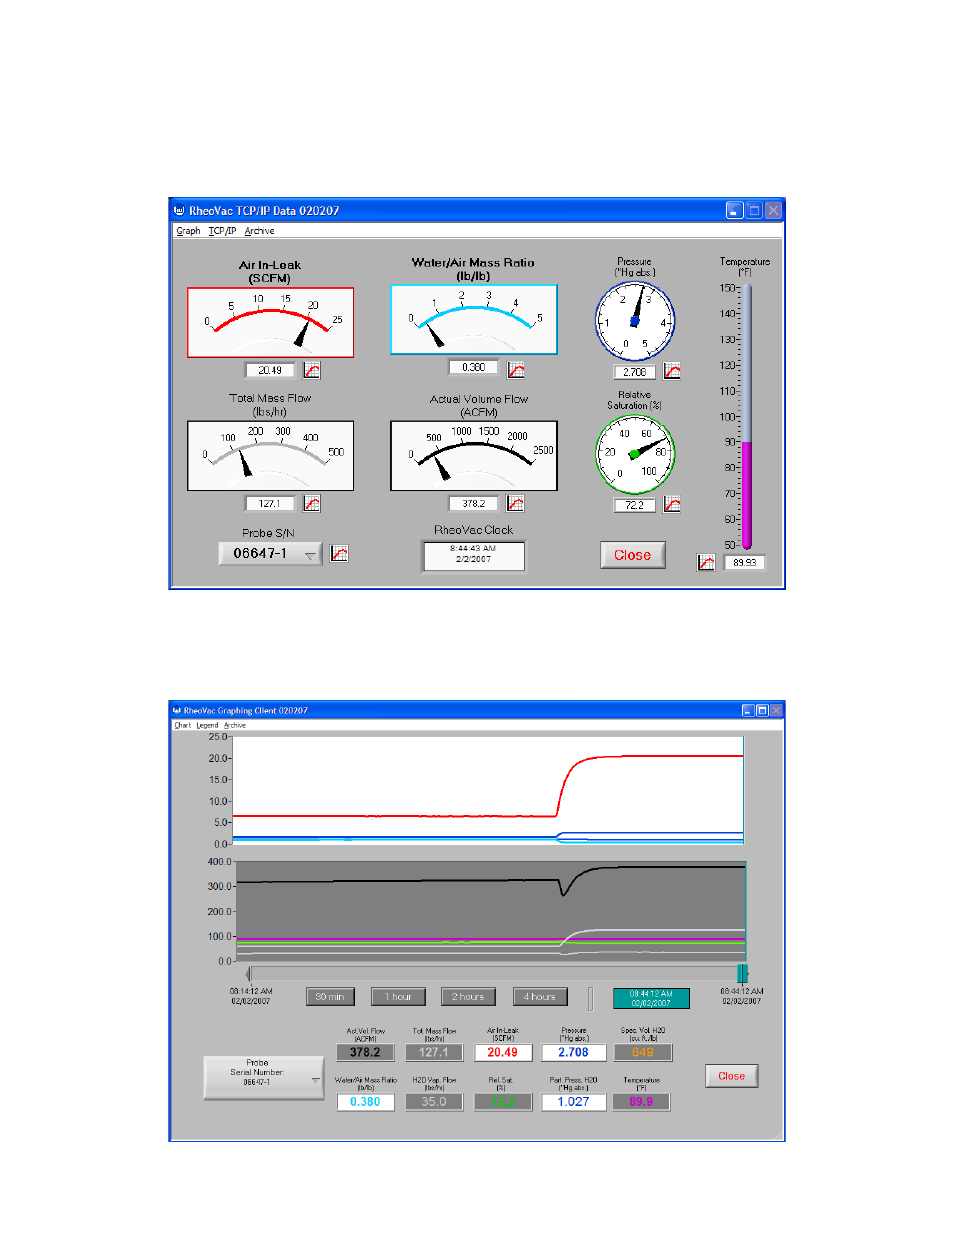
Figure B - User Interface Software Data Monitor Feature
Figure C - User Interface Software Graph Feature
Click on the small graph image to view a historical graph of that parameter.
Se l e c t
from all available probes by clicking on the Probe S/N menu.
To do real-time graphing, select from the graph menu. The screen shown in Figure C
appears.