0 main control window, Overview, Real time graph – Grant Instruments Labwise User Manual
Page 10: Optima status information
May 2012
Page 10
30853(1)
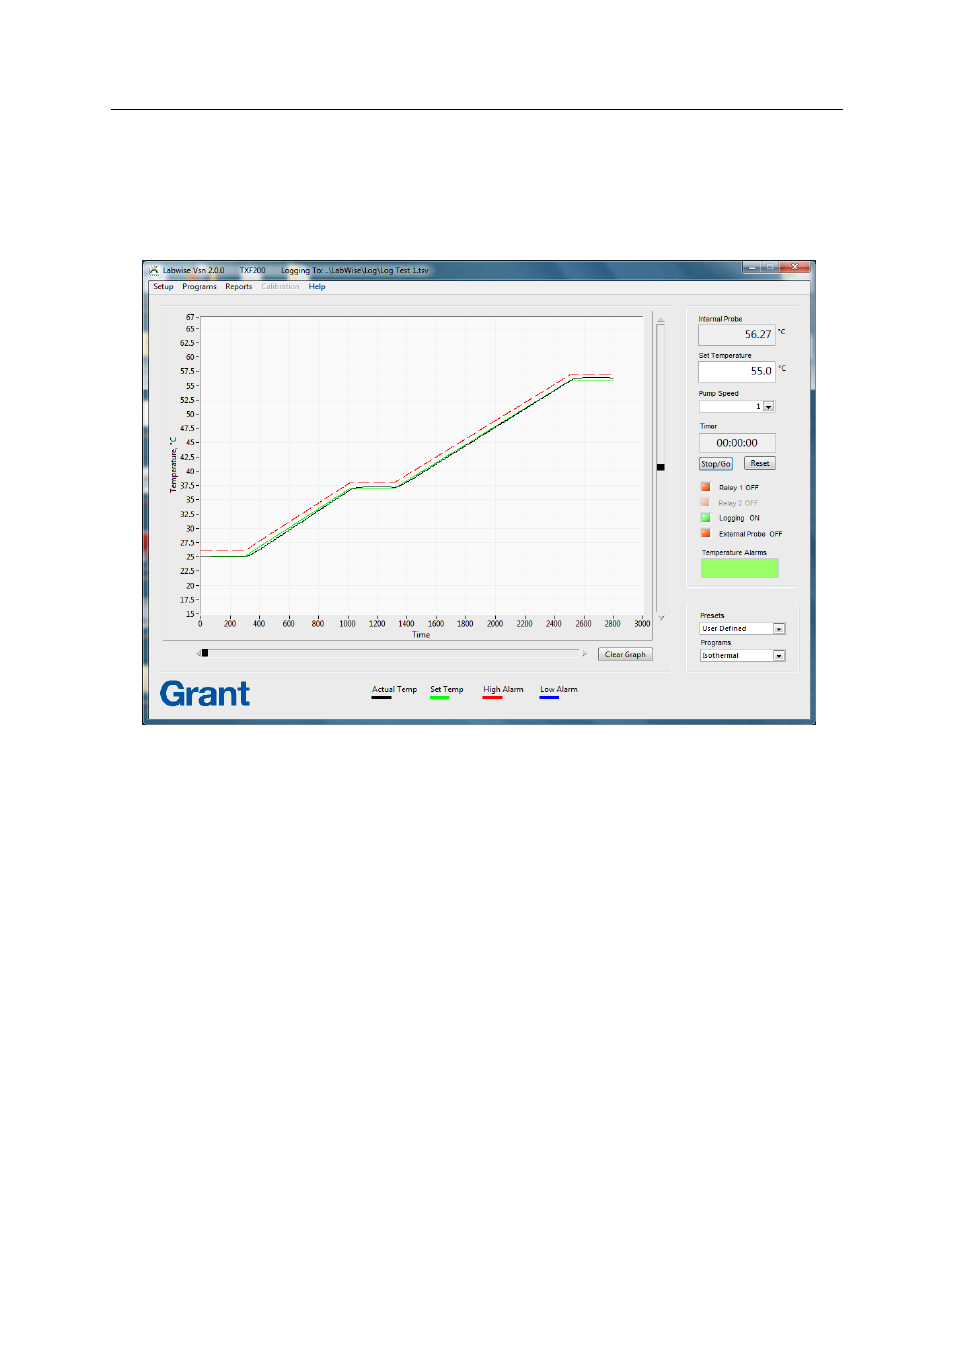
3.0 Main control window
3.1.
Overview
Labwise opens the main control window at start up. This window shows real time information
when an Optima is connected.
3.2.
Real time graph
The real time graph plots set temperature (green line) and measured temperature (black
line). If a high alarm (red line) or a low alarm (blue line) are configured then these will also
be displayed as dashed lines. The graph will update continuously.
Horizontal (time axis) and vertical (temperature range) scrollbars are provided next to the
real time graph. The scrollbars provide dynamic rescaling of the time and temperature axes
to allow zooming in and out to show the data more clearly.
3.3.
Optima status information
The numerical values of the set temperature, measured temperature (either by the internal or
the external probe) and pump speed are continuously displayed. Set temperature can be
changed by updating the value and pressing tab to confirm. The pump speed can be
changed using the drop down menu (GP200 and TXF200 only).
In normal operation the timer corresponds to the Optima timer. The control buttons allow the
timer to be controlled via Labwise. If a program is running then the timer changes to show
the current segment number and the current segment time remaining.