7typic al performance dia gr ams – Camco Q-Power 10 User Manual
Page 26
100
1k
10k
50
500
200
2k
5k
20k
20
-30
-40
-50
-60
-70
-80
-90
-100
dBr
Hz
100
1k
10k
50
500
200
2k
5k
20k
20
-20
-40
-60
-80
-100
-120
-30
-50
-70
-90
-110
dBr
Hz
-30
-40
-50
-60
-70
-80
-90
-100
-40
-50
-60
-30
-20
-10
0
+10
dB
dBu
-40
-50
-60
-30
-20
-10
0
+10
-20
-30
-40
-50
-60
-70
-80
-90
-100
dB
dBu
7
TYPIC
AL PERFORMANCE DIA
GR
AMS
USER MANUAL
Q - P O W E R S E R I E S
P. 25
Q - P O W E R
S E R I E S
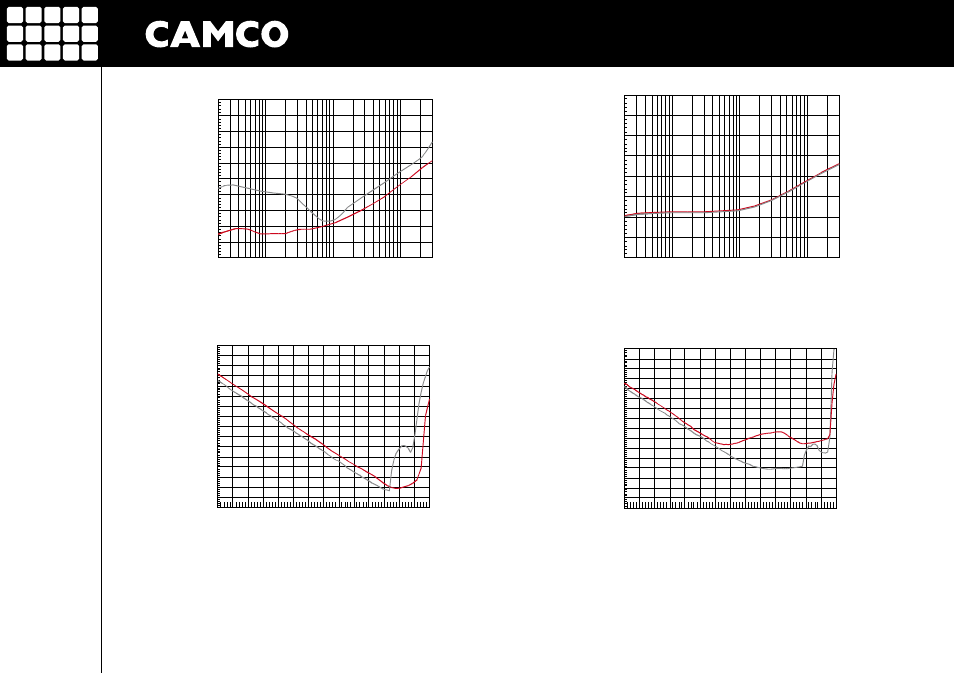
Figure 7.6
DIM intermodulation distortion @ 8 Ω vs. input level
(Q-POWER 6,
Q-POWER 10
)
(Measurements of a typical performance)
Figure 7.8
SMPTE intermodulation distortion (60 Hz and 7 kHz) @ 8 Ω vs. input level
(Q-POWER 6,
Q-POWER 10
)
(Measurements of a typical performance)
Figure 7.5
Channel separation vs. frequency @ 0 W / 4 Ω
(Q-POWER 6,
Q-POWER 10
)
(Measurements of a typical performance)
Figure 7.7
Common mode rejection ratio (Q-POWER 6,
Q-POWER 10
)
(Measurements of a typical performance)