Vernier BlueView Transilluminator User Manual
Page 3
5
Gel Analysis in Logger Pro
The buttons along the right side of the photo will be used. The first four, shown
below, are the primary Gel Analysis tools. Holding the mouse over each button will
display its function. Text above the photo serves as a reminder of the next step in the
analysis.
Set Origin
Set Scale
Set Standard Ladder
Add Lane
4. Set Origin. In this step, you will show Logger Pro the position of the wells on
the photo.
Click the Set Origin button. Click on the photo just to the
left of the first well. A yellow coordinate system will appear
on the photo. The x-axis should go directly along the
bottom edge of the wells. You can move the origin by
grabbing either axis with the mouse and dragging it to the desired location.
The axes can be rotated by grabbing the round handle on the x-axis.
5. Set Scale. This optional step converts the units of distance measured from
number of pixels into millimeters or centimeters.
Click the Set Scale button. Drag the mouse between two
points of known distance apart. A window will appear
prompting you to enter this distance and its units. Note: If
your gel tray does not have a built-in ruler, you could measure either the
width or length of the gel tray and use as your reference. If no reference is
available, distances will be displayed in pixels, but base pair calculations
will be correct.
6. Set Standard Ladder. In this step, you will identify the bands of the standard
ladder and input their base pair values. Logger Pro will automatically create a
standard curve on the graph.
Click the Set Standard Ladder button. Click on the band
closest to the well of the standard ladder lane. Type the
corresponding number of base pairs into the field provided
in the resulting dialog box and click OK. Moving down this
lane, repeat these steps for each visible band of the standard ladder. Notice
the Standard Curve being created on the graph once you have added the
second point.
7. Add Lane. In this step, you will identity the experimental bands on the photo.
Logger Pro will then plot and calculate their respective number of base pairs
Click the Add Lane button and choose the Add Lane option.
Position the cursor over the leading edge of the band closest
6
to the well of the first experimental lane and click. Take a moment to notice
that when you click, three things happen: a marker with a distinct shape and
color was placed on the photo, a matching marker was placed on the graph,
and the distance and number of base pairs is added to the data table as
shown in Figure 3.
Continue in order down the lane, clicking on each of the remaining bands.
8. To analyze another lane, click on the Add Lane button again, choose Add Lane,
and repeat Step 7. Repeat this process for each experimental lane until the entire
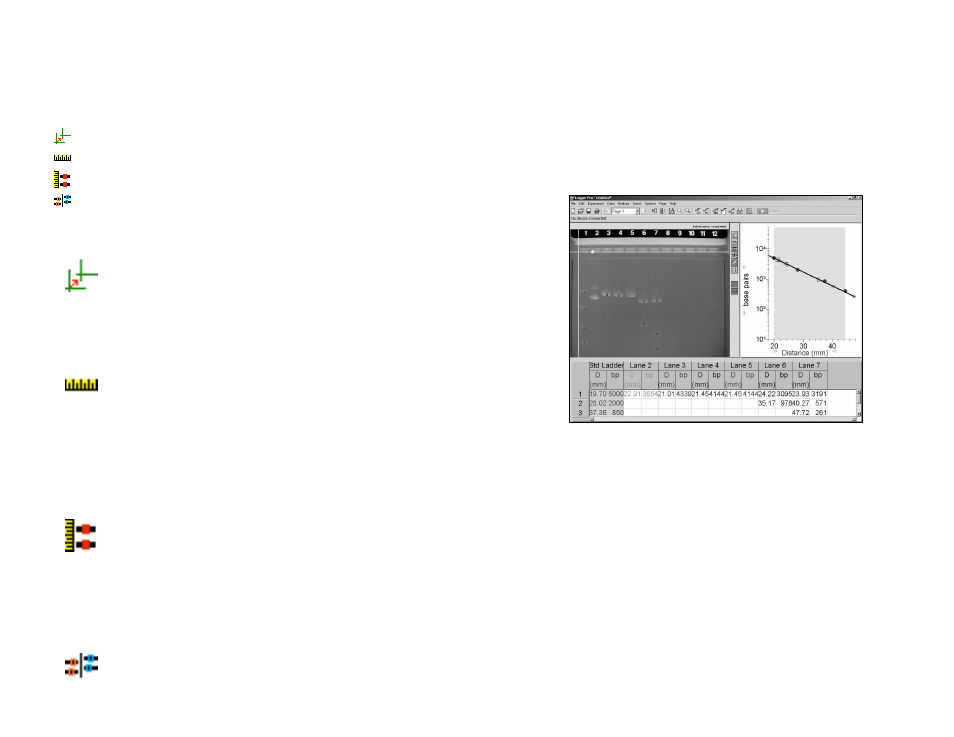
gel has been analyzed, as shown in Figure 5.
Figure 5: Completed Gel Analysis