Storage performance - i/os per second (iops), Consolidation improvement factor, Igure 4 – Dell POWEREDGE R720 User Manual
Page 7: Cpu utilization, Igure 5, Input/output operations per second
Consolidating Legacy OLTP Application Servers with the Dell 12
th
Generation PowerEdge R720
Server
7
Figure 4. CPU Utilization
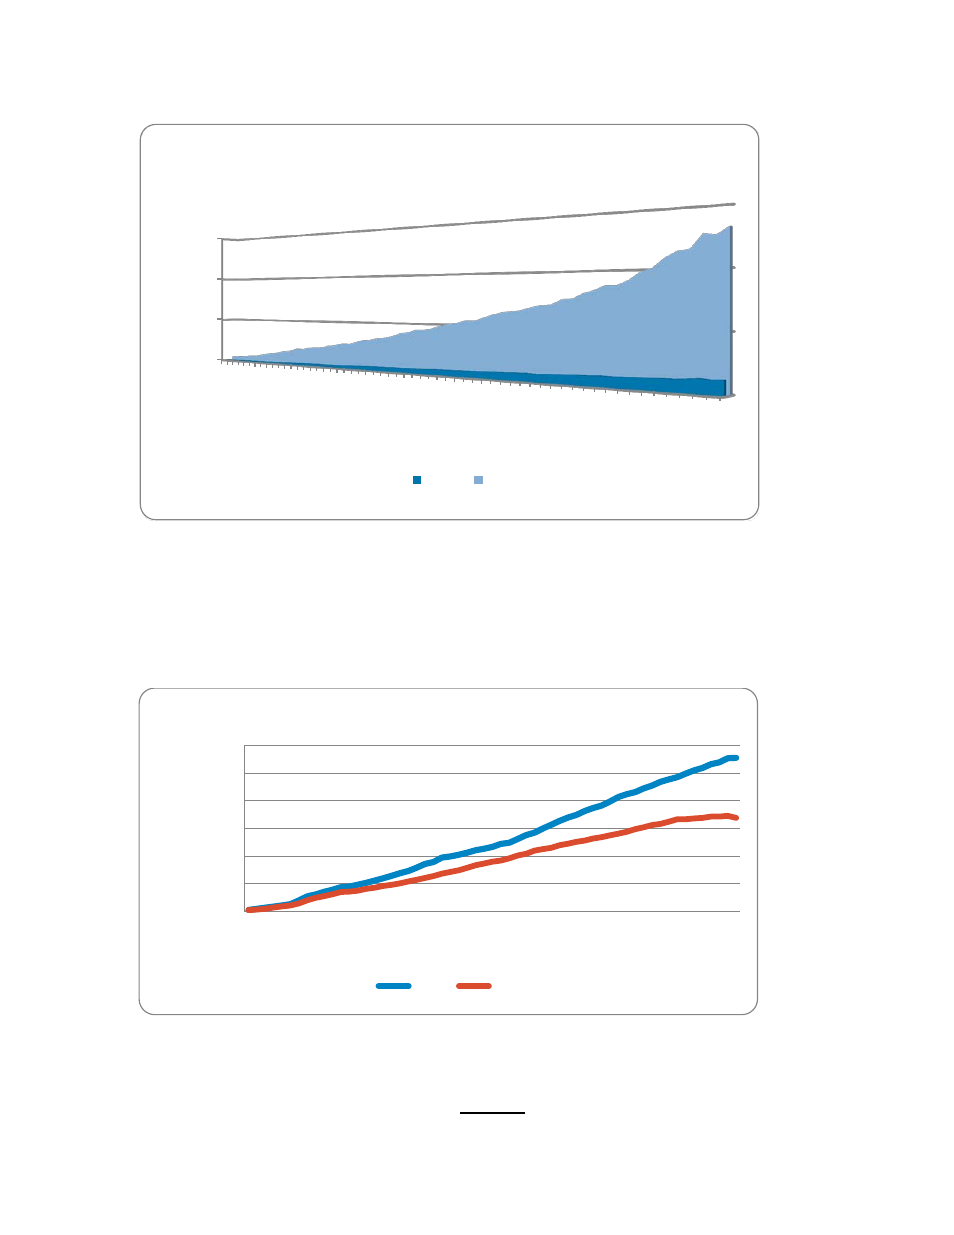
Storage Performance - I/Os per second (IOPS)
When measuring a storage system’s performance, Input/Output operations per second (IOPS) is
the most commonly used metric. The legacy environment achieved an average of 6,760 IOPS
while the PowerEdge R720 was able to achieve 11,110 IOPS: a 60% improvement. Figure 5
illustrates these results.
Figure 5. Input/Output Operations Per Second
Consolidation Improvement factor
After reviewing the results, we can conclude that a PowerEdge R720 server running Microsoft
SQL Server 2012 can process OLTP queries nearly
4x faster when compared to a legacy server
running Microsoft SQL Server 2005 while maintaining an SLA of 2 seconds.
0
10
20
30
25
0
10
0
0
175
0
25
00
3
2
50
4
0
0
0
4
75
0
5
50
0
6
2
50
70
0
0
77
50
85
0
0
9
2
50
10
0
0
0
10
75
0
115
0
0
1225
0
13
0
00
137
5
0
14
50
0
%
p
ro
ces
so
r t
im
e
(l
o
w
er
is
b
et
ter
)
CPU Utilization at 14,750 concurrent users
R720
PE2950
0
2000
4000
6000
8000
10000
12000
25
0
10
0
0
175
0
25
00
3
2
50
4
0
0
0
4
75
0
5
50
0
6
2
50
70
0
0
77
50
85
0
0
9
2
50
10
0
0
0
10
75
0
115
0
0
1225
0
13
0
00
137
5
0
14
50
0
IO
P
s
(h
ig
h
er
is
b
et
te
r)
IOPS at 14,750 concurrent users
R720
PE2950