Wiring, Measurement, Interpreting data – Campbell Scientific LWS Decagon Leaf Wetness Sensor User Manual
Page 7
LWS-L Dielectric Leaf Wetness Sensor
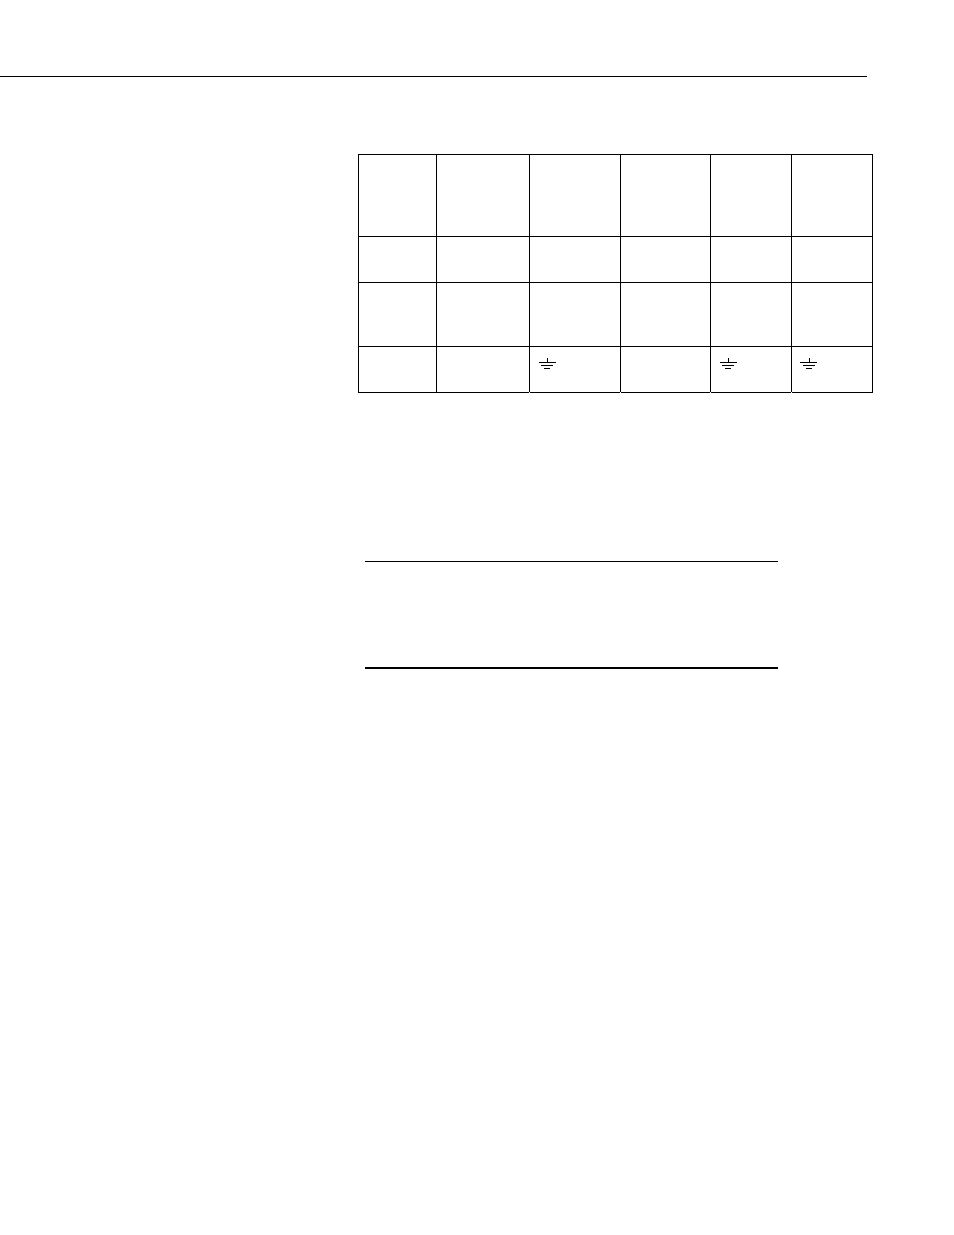
4. Wiring
Color
Description
CR800/850
CR5000
CR3000
CR1000
CR500/510
CR10/10X
21X
CR7
CR23X
CR200
White Excitation
Switched
Excitation
Switched
Excitation
Switched
Excitation
Switched
Excitation
Red Analog
Out
Single-
Ended
Channel
Single-
Ended
Channel
Single-
Ended
Channel
Single-
Ended
Channel
Bare Analog
Ground
AG
5. Measurement
The LWS-L requires excitation voltage between 2.5 and 5 VDC. It produces
an output voltage dependent on the dielectric constant of the medium
surrounding the probe. Output voltage ranges from 10 to 50% of the excitation
voltage.
The LWS-L is intended only for applications wherein the
datalogger provides short excitation, leaving the probe quiescent
most of the time. Continuous excitation may cause the probe to
exceed government specified limits on electromagnetic
emissions.
NOTE
6. Interpreting Data
Many leaf wetness applications, such as phytopathology, require a Boolean
interpretation of leaf wetness data, i.e. whether or not water is present. A
Boolean threshold is determined by analyzing a few days of time series data.
Consider time series data in Fig. 3, which were obtained at 5 VDC excitation.
The sensor yields ≈445 mV when dry, ≈475 mV when frosted, and >>475 mV
when wet. Therefore, a Boolean wetness threshold of 500 mV should serve
well for interpreting these data.
3