Thermo Fisher Scientific CyberComm Pro for CyberScan CON 1500 User Manual
Page 14
Instruction Manual
CyberComm CON 1500
10
4.2.1
Function Icons
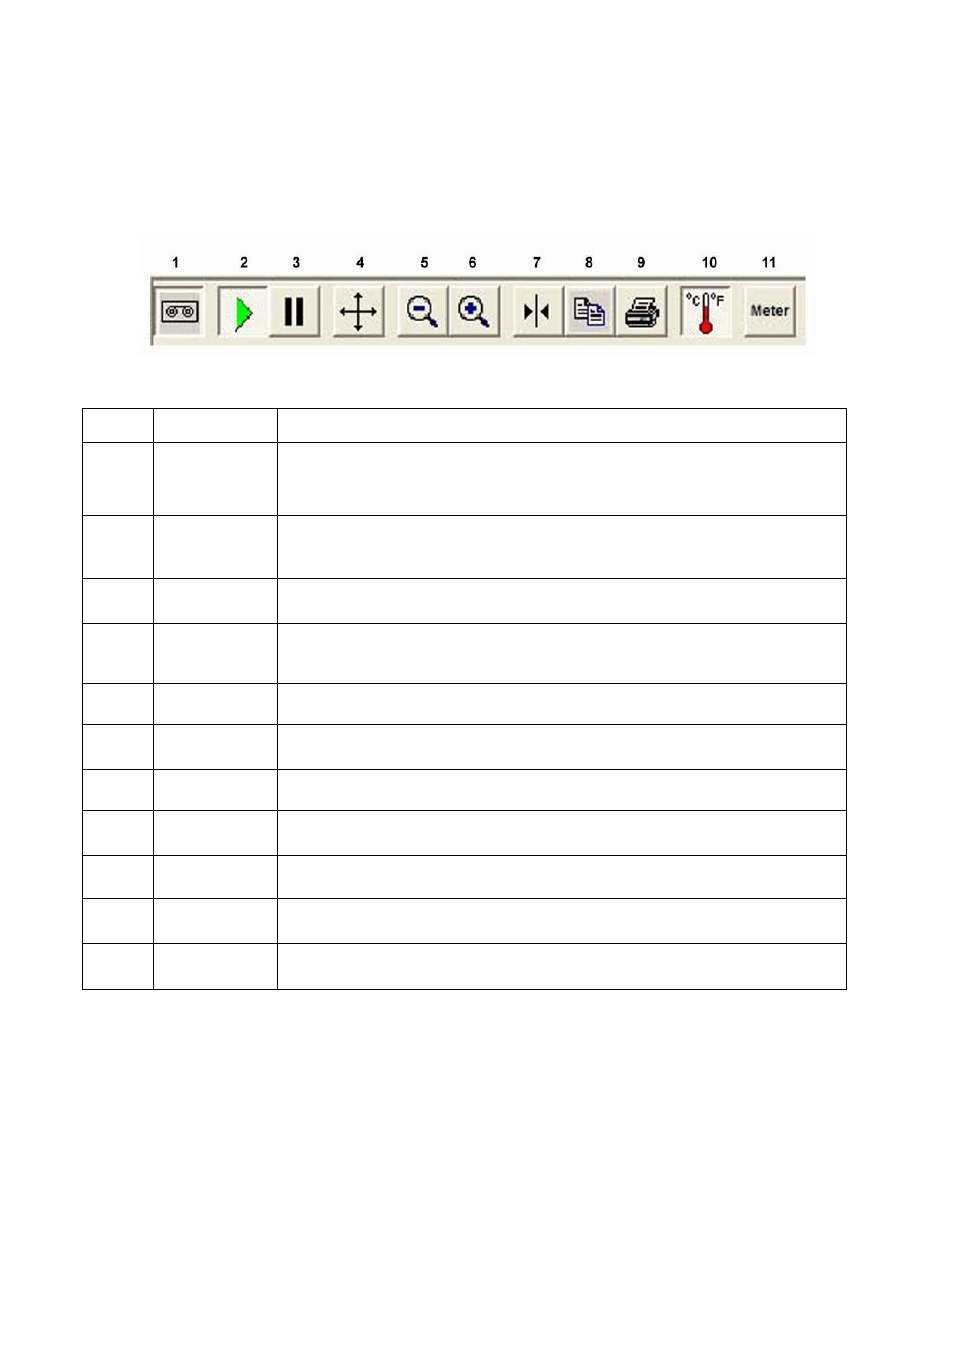
See Figure 13. See also Figure 12.
The function icons on the main menu each serve a vital role in the CyberComm Pro software, providing user
friendly one click access.
Figure 13: Function Icon Panel (extracted from Figure 12)
Icon
no.
Function Name
Description
1
Record
Click on this icon to start recording meter readings, readings will be shown on the CyberComm
Pro main menu. Data captured will also be stored to the hard disk (in a “.csv” formatted file). A
pop-up menu will prompt you whether to overwrite saved data should you already have recorded
data reading. New data should be saved under a NEW file name. See Figure 14.
2
Resume Tracking
Works together with the ‘Pause Tracking’ icon. Click on either to Resume or Pause the meter
tracking. Tracking means that the current reading is always visible and the graph window will
scroll to show the current reading like a chart recorder.
3
Pause Tracking
Refer to Icon 2.
4
Scroll/Zoom
Use this function to drag along single axis at a time to expand selected region of the reading
curve
5
Zoom Out
Click to enlarge screen image
6
Zoom In
Click to minimise screen image.
7
Show Cursor
Shows a green guide line on the graph. You are able to drag the guide across the readings to get
the exact or extrapolated readings at any point on the curve.
8
Copy to clipboard
Copy the entire graph to the clipboard. You can then paste it to other applications.
9 Print
A print screen will pop up and the graph will become black and white in colour for a print preview
of your readings. See Figure 15.
10
Show/Hide
Temperature
Choose to view your readings with or without the temperature curve by clicking this icon.
11
Meter Settings
Parameter Settings. See Figures 16 for details.