Display description – General Technologies ST05 Oxygen Sensor Tester and Simulator User Manual
Page 3
Page 4
Page 3
3. OPERATION
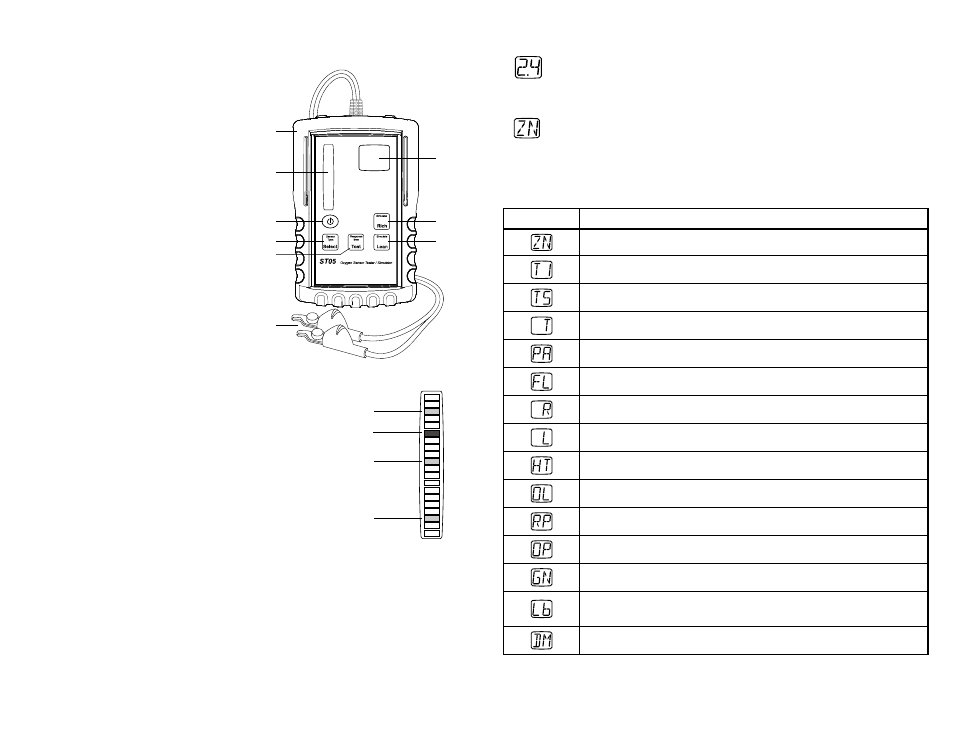
3.1 Instrument Description
1) Protective rubber holster
2) Alphanumeric display
3) Analog LED bargraph
4) Power ON/OFF button
5) Simulate sensor “RICH” condition
6) Sensor type select button
7) Simulate sensor “LEAN” condition
8) Response time test button
9) Test leads with clips
3.2.2 Alphanumeric display description
Numerical readout
During normal operation, the alphanumeric display shows the number of
crossings per second (cross-count) of the oxygen sensor signal.
Selection and message readout
When selecting the type of sensor, performing functions or during certain error
conditions, the alphanumeric display shows two characters codes that identify
the selection, status of a function, or error condition. Below is a table with display
readouts and their descriptions.
Display
Description
Zirconia sensor selected
Titanium sensor selected for 1 Volt systems
Titanium sensor selected for 5 Volt systems
Flashes while performing response time test
Passed the response time test ( < 100 ms)
Failed the response time test ( > 100 ms)
Flashes when simulating a rich fuel condition
Flashes when simulating a lean fuel condition
Test leads connected to heater wire(s) or circuit with more than 6 Vdc
Overload current was detected when simulating Rich or Lean
Reverse polarity detected: to correct reverse test lead connections
Open circuit detected: check for loose connections
Ground connection detected: check test leads connections
Flashing indicates low battery: replace battery
This message will display momentarily when selecting the demo mode
3.2 Displays Description
3.2.1 Analog bargraph description
Real time signal
Displays the actual signal voltage output of the
oxygen sensor in real time.
Maximum
Displays the maximum voltage reached by the
signal (updated every new cycle).
Minimum
Displays the minimum voltage reached by the
signal (updated every new cycle).
Average
Displays a calculated time average of the oxy-
gen sensor output, in order to detect rich or lean
working conditions (updated every new cycle).
Maximum
Real time signal
Average
Minimum
.
•
If no crossings (cycles) of the input signal are detected for more than 10 sec-
onds or if the input voltage is out of range, only the real time signal indicator will
be displayed.
•
If the input signal exceeds the display range of the bargraph, only a flashing
dot will be shown at the top of the bar for an overvoltage and at the bottom for
an undervoltage condition. This could happen, if for example, the test leads are
connected to the sensor with the polarity reversed, or if the instrument is set for
Zirconia sensors, but connected to a Titanium 5 Volt system.
Fig. 1 - Instrument description
Fig. 2 - Bargraph description
1
3
2
4
6
8
5
7
9