P.23, 7 typical performance diagrams – Camco iD4 TDA302USERGBE User Manual
Page 23
USER MANUAL
i - S E R I E S
i - S E R I E S
A D V A N C E D A M P L I F I E R S
P.23
50k
10k
1k
100
10
Hz
+1
+0,5
0
-0,5
-1
-1,5
-2
-2,5
-3
-3,5
-4
dBr
20k
-60
-50
-40
-30
-20
-10
0
10
dBu
1
0,1
0,01
0,001
%
-60
-50
-40
-30
-20
-10
0
4
dBu
1
0,1
0,01
0,001
%
20k
10k
1k
100
20
Hz
1
0,1
0,01
0,001
%
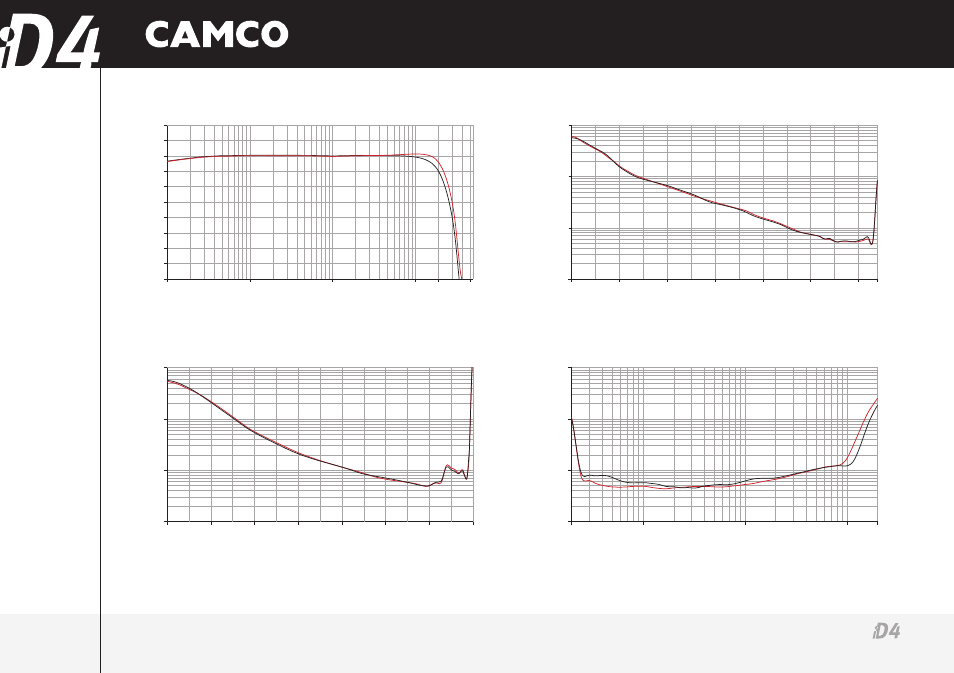
7 TYPICAL PERFORMANCE DIAGRAMS
7. Typical Performance Diagrams
Figure 7.1
Gain vs. frequency, 120 W output power
(Measurement of a typical performance @ 2 Ω &
4 Ω
)
Figure 7.2
THD @ 1 kHz vs. input level @ 4 Ω load (32 dB amplifier gain)
(Measurement of a typical performance of Ch 1 &
Ch 2
)
Figure 7.3
THD @ 1 kHz vs. input level @ 2 Ω load (32 dB amplifier gain)
(Measurement of a typical performance of Ch 1 &
Ch 2
)
Figure 7.4
THD vs. frequency, 120 W output power
(Measurement of a typical performance @ 2 Ω &
4 Ω
)