Xylem 19 001 351R2 PACE Integrated Pump Controller Human Machine Interface (HMI) for the Silent Storm VFD Pumping System – User Guide User Manual
Page 23
23
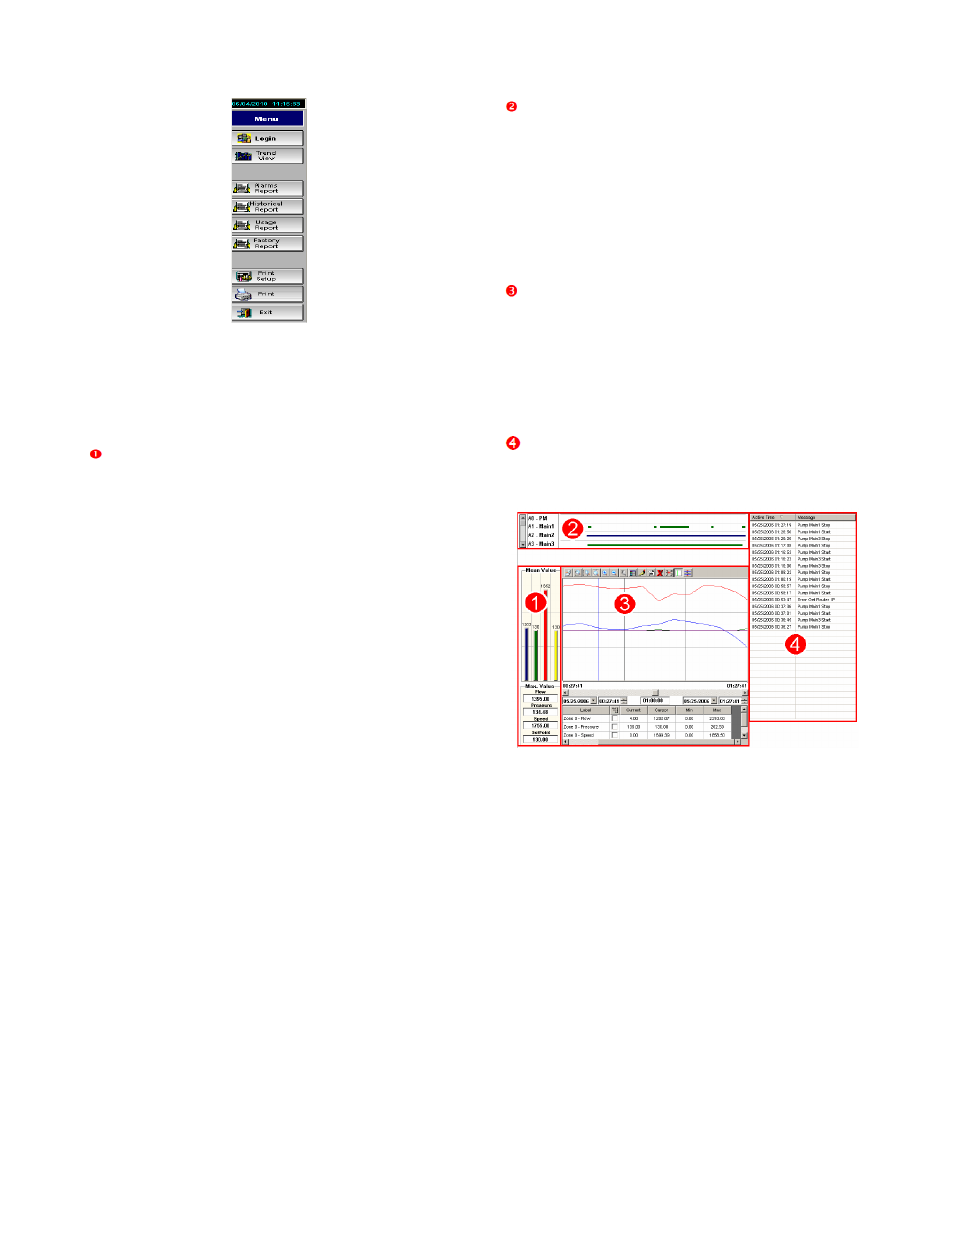
Figure 49: Web Reports Menu
Trend View
Select [Trend View] from the Web Reports Menu.
There are four key parts to the trends screen.
Mean Value Graph and Detail: For each of the
key variables (Flow, Pressure, Speed, and
Setpoint) the mean values are displayed as a
vertical bar graph on the top while the Maximum
values are displayed in fields below.
Pump Run Log: Graphically displays the pump
operation for the time frame selected. These are
color coded:
•
Green - indicates pump is running
•
Blue - indicates pump is running on
VFD.
•
Red - indicates pump is in a fault
condition.
Variables Graph: Line graph displays color-
coded information for key variables over a specified
time. The top bar of the graph also has zoom,
period, and legend options. The grid below displays
variable data. Click […] to choose line colors.
Choose the start date, time and duration for the
graph from fields positioned between the graph and
grid.
Events Listing: Details the time and events for
a duration time defined by the user, as for the
variables graph.
Figure 50: Trends View
Alarms Report
Select [Alarms Report] from the Web Reports
Menu.
Alarms Report allows you to view the last 10
system alarms and events.