3B Scientific Dual Pole Tube User Manual
Page 3
Elwe Didactic GmbH • Steinfelsstr. 6 • 08248 Klingenthal • Germany • www.elwedidactic.com
3B Scientific GmbH • Rudorffweg 8 • 21031 Hamburg • Germany • www.3bscientific.com
Technical amendments are possible
© Copyright 2010 3B Scientific GmbH
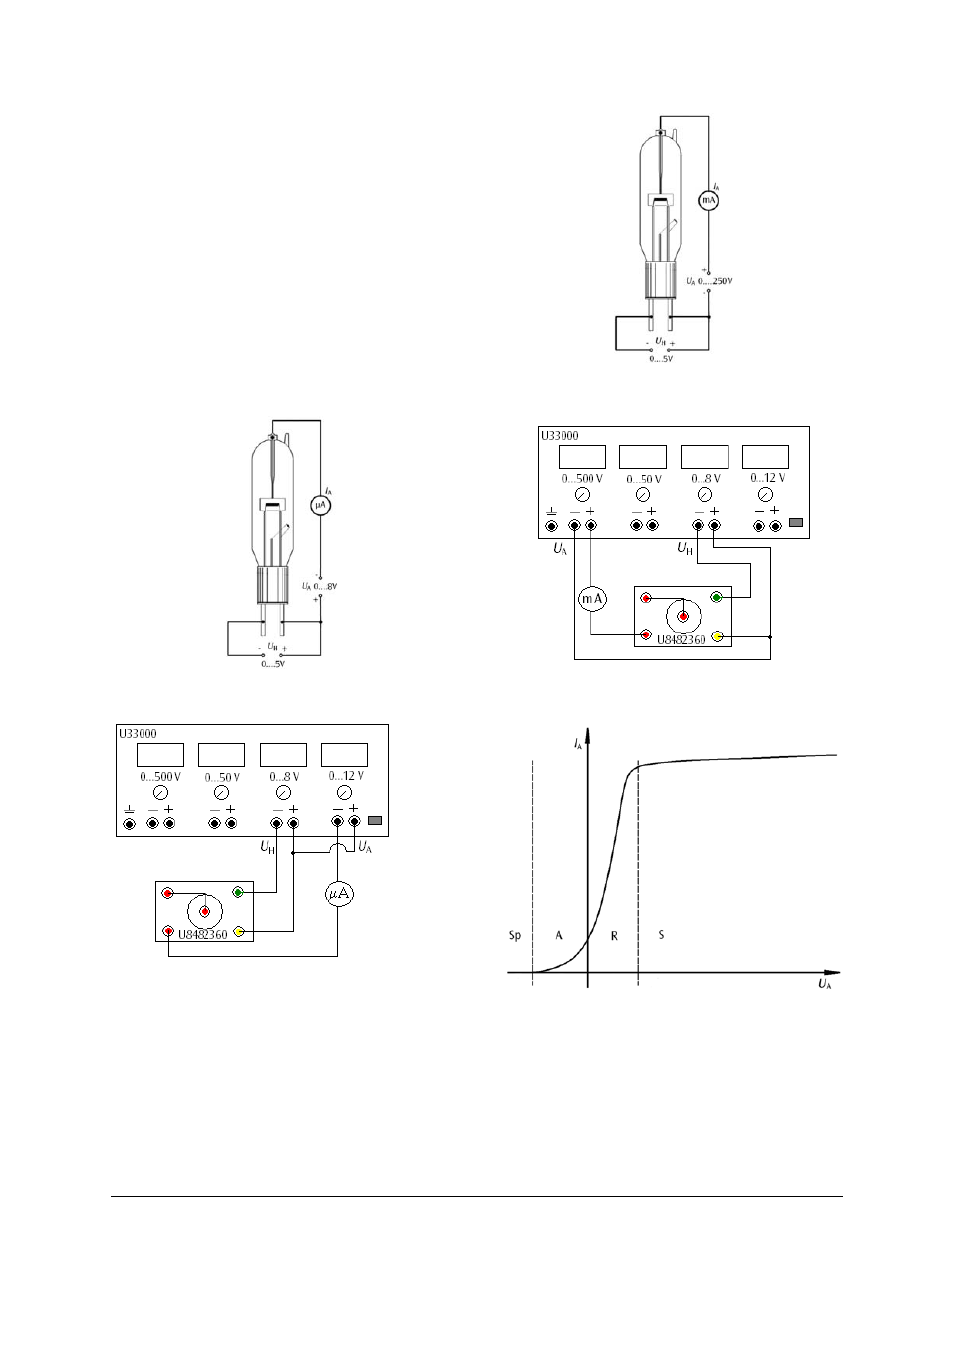
6.2 Measuring the current/voltage characteristic
(I
A
/U
A
curve) of a diode
Figure 5 shows the different regions of a typical
curve, which can be measured using two circuits.
The cutoff region (Sp) and the current onset region
(A) are measured by applying a negative anode
voltage, which is progressively reduced up to the
beginning of the space-charge region (R). This part
of the measurement ends with U
A
= 0 V.
•
For the latter regions, connect the circuit as
shown in Figures 3a/b.
•
Determine how the anode current I
A
depends
on the anode voltage U
A
by decreasing the
anode voltage step by step from -8 V to 0 V.
•
Plot the values of I
A
and U
A
on a graph.
Fig. 3a Circuit set-up for measuring the current onset
region
Fig. 3b
Circuit connection of the 500 V DC power
supply (U33000)
The space-charge region (R) and the saturation
region (S) of the curve are measured by applying a
positive anode voltage that is varied over the range
0…250 V.
•
Connect the circuit as shown in Figures 4a/b.
•
Determine how the anode current I
A
depends
on the anode voltage U
A
by raising the anode
voltage step by step from 0 V to 250 V.
•
Plot the values of I
A
and U
A
on a graph.
Fig. 4a Circuit set-up for measuring the space-charge
and saturation regions
Fig. 4b
Circuit connection of the 500 V DC power
supply (U33000))
Fig. 5
Current/voltage characteristic of a diode