3B Scientific Ultrasonic Echoscope User Manual
Page 4
14
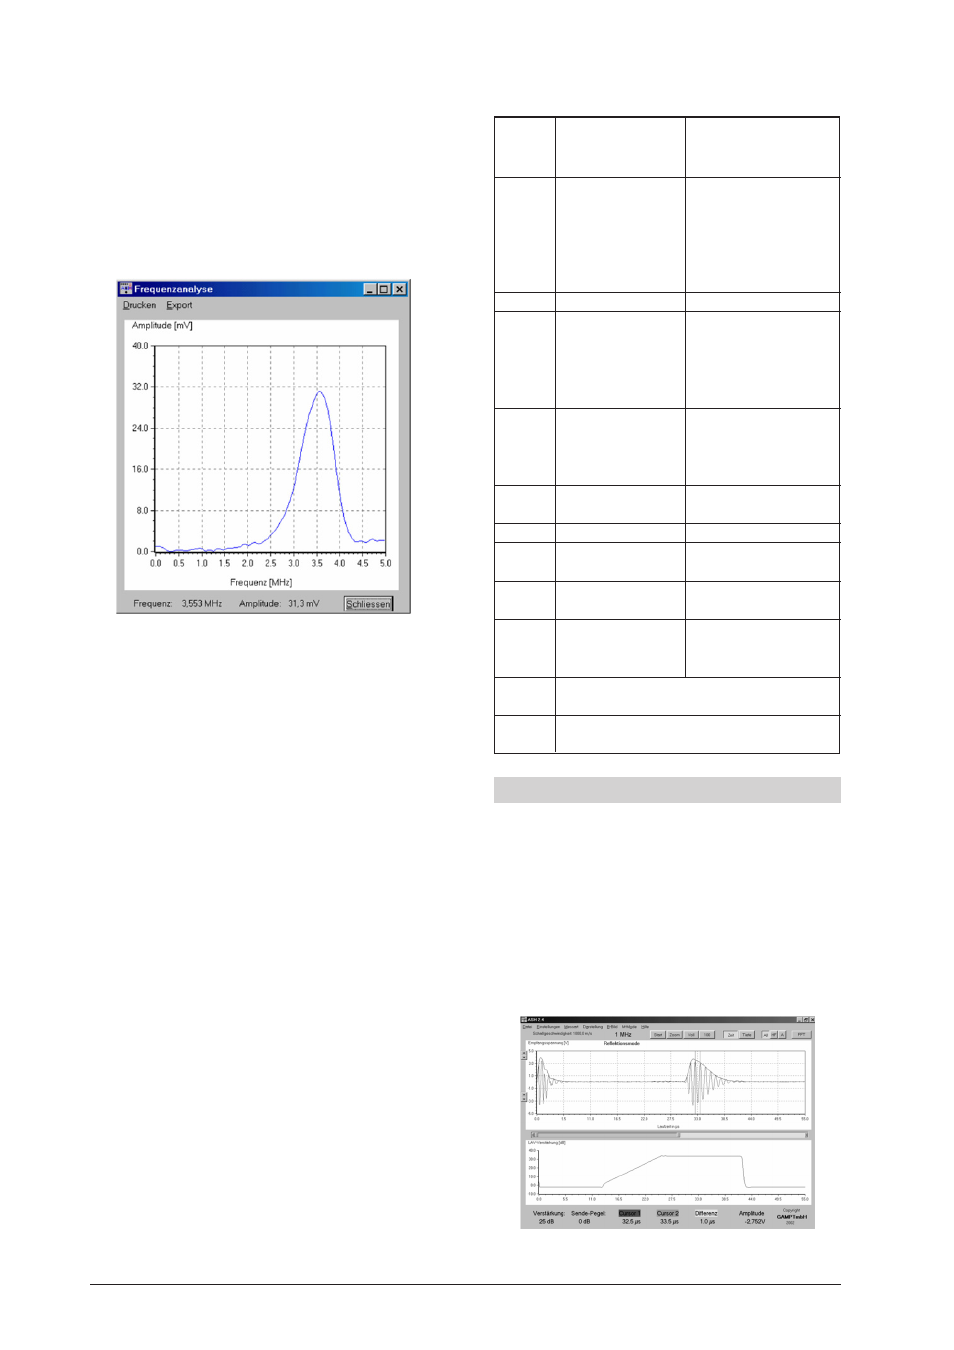
The constant updating of the A image can be suspended
(Freeze) by using the "Stop" button and restarted us-
ing the "Start button". When the image is frozen, the
FFT button becomes active. If this is clicked, the am-
plitude spectrum of the segment of signal bounded by
the markers is displayed in a new window (see illustra-
tion below.)
At the same time, a measurement function using the
mouse is activated (crosshair cursor). Frequency and
amplitude are displayed at the position where the
mouse is situated. The form can be printed (standard
printer under Windows), or the spectrum can be saved
(as an ASCII table) using the Export function.
The "Zoom" button magnifies the display of a selected
depth range. Position and width of the range are set
by moving the sliders in the middle of the screen with
the mouse. The "Full" button causes the "Zoom" func-
tion to be deactivated again.
The button marked "100"/"200" allows the measuring
range (maximum time or resolution) to be switched
between 100
µ
s and 200
µ
s. The "A" [A image], "HF"
[High-frequency signal] and "All" [both signals] settings
allow you to select the form in which the signal should
be displayed.
In the central region of the screen, the characteristics
for time-dependent amplification are shown includ-
ing all parameters (start point, rise time, width, thresh-
old). At the bottom of the window, status information
is displayed. Among the items shown here are the time
or the depth represented by the current marker posi-
tions. The difference between the red and green mark-
ers is displayed in yellow. The current transmitted level
and primary gain are shown at the bottom left. The
bottom right gives the amplitude of the received volt-
age at the mouse cursor position (the center of the
crosshair.)
3.2. Menu functions
File
Print Form
Prints the window
(form) to the
current printer
Export
Exports the
measured values as
an ASCII table to
a text file (columns:
Time, HF data,
A image, TGC),
Exit
Exit the program
Settings Speed of
Entry for the speed
sound
of sound to allow
correct display of
depth (default:
1000 m/s)
Port
Selection of LPT
port for
communication with
controlling PC
Type of
Duration
Axis = time
meas.
(default)
Depth
Axis = depth
Display
A-scan
Displays the A
image (A mode)
HF data
Displays the HF
signal (Echo)
All
Displays both signals
(HF echo and A line/
envelope)
B image Activates the form for displaying a
B image (B-mode image)
M-mode Activates the form for displaying an
M-mode image
4. Suggested experiments
4.1. Wave nature of ultrasound
With the aid of the software, it is possible to display a
signal corresponding to a reflection, e.g. between an
acrylic block and air, in HF mode (high frequency os-
cillation), in A mode (amplitude component = enve-
lope of HF signal) and in both modes at once. This can
convey to the student which signal gives rise to a typi-
cal A image. Below is a screenshot of the software user
interface showing the measured signal at the top and
the settings for the amplifier underneath it.