3B Scientific Stirling Engine G User Manual
Page 3
3
5.3 Plotting a graph of pressure against volume
when the Stirling engine is being used as a
heat pump
Additional instruments needed:
DC Power supply 15 V, 1.5 A
U8521121-230
or
DC Power supply 15 V, 1.5 A
U8521121-115
3B NETlog
TM
U11300-230
or
3B NETlog
TM
U11300-115
3B NETlab
TM
U11310
Relative pressure sensor, ±1000 hPa
U11322
Displacement sensor
U11371
Sensor Holder for Stirling Engine G
U11372
•
Attach the holder for the sensor to the base plate
of the Stirling engine.
•
Fit the relative pressure sensor to the bottom of
the sensor holder and the displacement sensor
at the top with the printed sides of the sensors
both facing upwards.
•
Connect the nozzle marked “+” on the relative
pressure sensor to the nozzle on the working cyl-
inder of the Stirling engine by means of the hose
included with the sensor holder (U11372) (see
Fig. 4).
•
Screw the cap nut attached to the string (sup-
plied with the sensor holder) onto the thread of
the working piston, thread the string around the
displacement sensor pulley and attach a coil
spring to the threaded rod (a detailed descrip-
tion of how to attach the sensor to the sensor
holder is included in the instruction manual for
the sensor holder U11372).
•
Connect the pressure sensor to analog input A of
the 3B NETlog
TM
unit and the displacement sen-
sor to analog input B.
•
Connect a DC voltage source via the 4 mm sock-
ets.
•
Adjust the voltage (maximum 12 V) and operate
the Stirling engine with the switch in the “down”
position.
•
Run the 3B NETlab
TM
software, open the experi-
ment “Stirling engine G” and plot a graph of
pressure against volume.
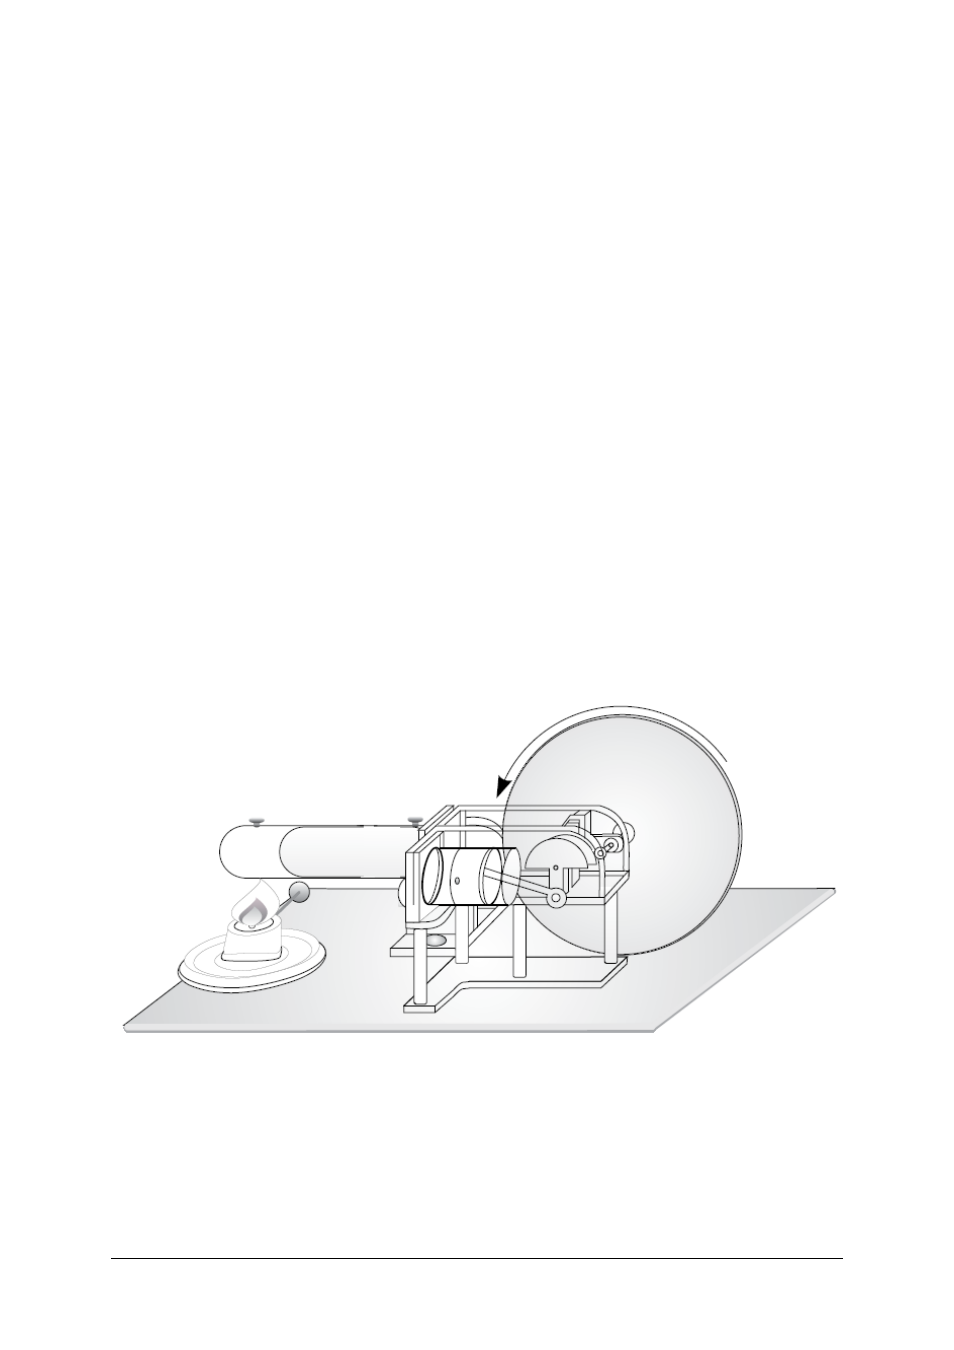
Fig.2
The Stirling motor as a heat engine