3B Scientific Software for Fourier Analysis User Manual
Page 4
4
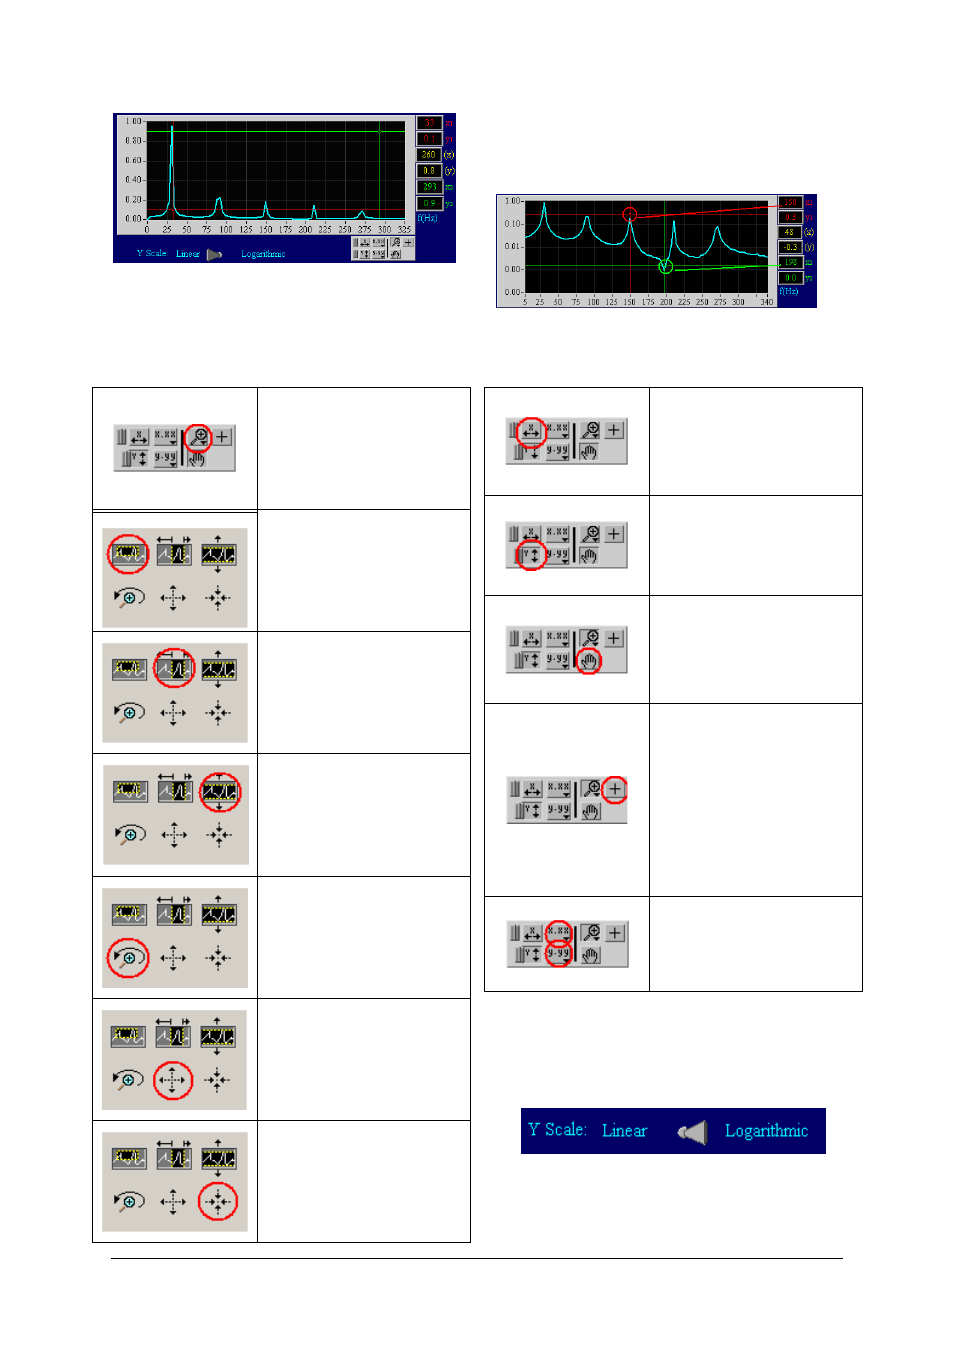
It is possible to overtype the numbers at either end
of the X or Y scales to change the X or Y ranges of the
graphs, but the graph palette permits you to carry
out a number of different actions on the graphs.
Note: If the location of the cursors is not clear, they
are located at the margins of the plot.
Click on the magnifying glass
at the bottom right hand side
of the graphs in order to
zoom in to any desired area
of the graphs.
Click on the top left to mark a
rectangular area into which
you want to zoom.
Click on the middle top to
mark an X range into which
you want to zoom.
Click on the top right to mark
a Y range into which you
want to zoom.
Click on the bottom left to
undo the previous zoom
operation.
Click on the middle bottom
and then click on a point on
the graph to expand the
scales centered on the point
where you have clicked.
Click on the bottom right and
then click on a point on the
graph to reduce the scales
centered on the point where
you have clicked.
Click on this button to auto-
scale in the X axis and display
the full X range of the data.
Click on this button to auto-
scale in the Y axis and display
the full Y range of the data.
Click on this button to enable
you to drag the graph range
around in both X and Y.
Click on this button to enable
you to move the red and
green XY cursors on the plot
area of the graphs. The X and
Y coordinates of the cursors
are displayed on the right
hand side of the graphs in red
and green respectively, and
the difference between the
two is shown in yellow.
Choosing the setting for the
axes.
Toggle the "Linear/Logarithmic" switch under the
Spectrum graph to change the Y scaling of the
spectrum graph.
The logarithmic mode enables you to notice small
amplitude components in the spectrum which are
often swamped in the linear scale so that they are
not noticeable.