3B Scientific Software for Fourier Analysis User Manual
Page 3
3
Pressing the Turn Sound On/Off button makes the
program output the resultant wave to the audio
output of the computer.
The Volume knob will appear or disappear depend-
ing on whether the sound is turned on or off.
Change the number in the "f = " box shown below to
change the fundamental frequency of the series.
The magnitudes and signs of the a and b coefficients
of the Sine and Cosines are shown in the fields be-
low. In some cases they are not used so the ampli-
tude is shown as zero.
3.3 Producing manual synthesized waveforms
Toggle the "Standard Waveforms/Manual" switch to
Manual in order to take manual control over the
amplitudes of the components.
Choose how you want to control the components of
your synthesized waveform, using either Sines and
Cosines or Sines and Phases (in units of
π radians):
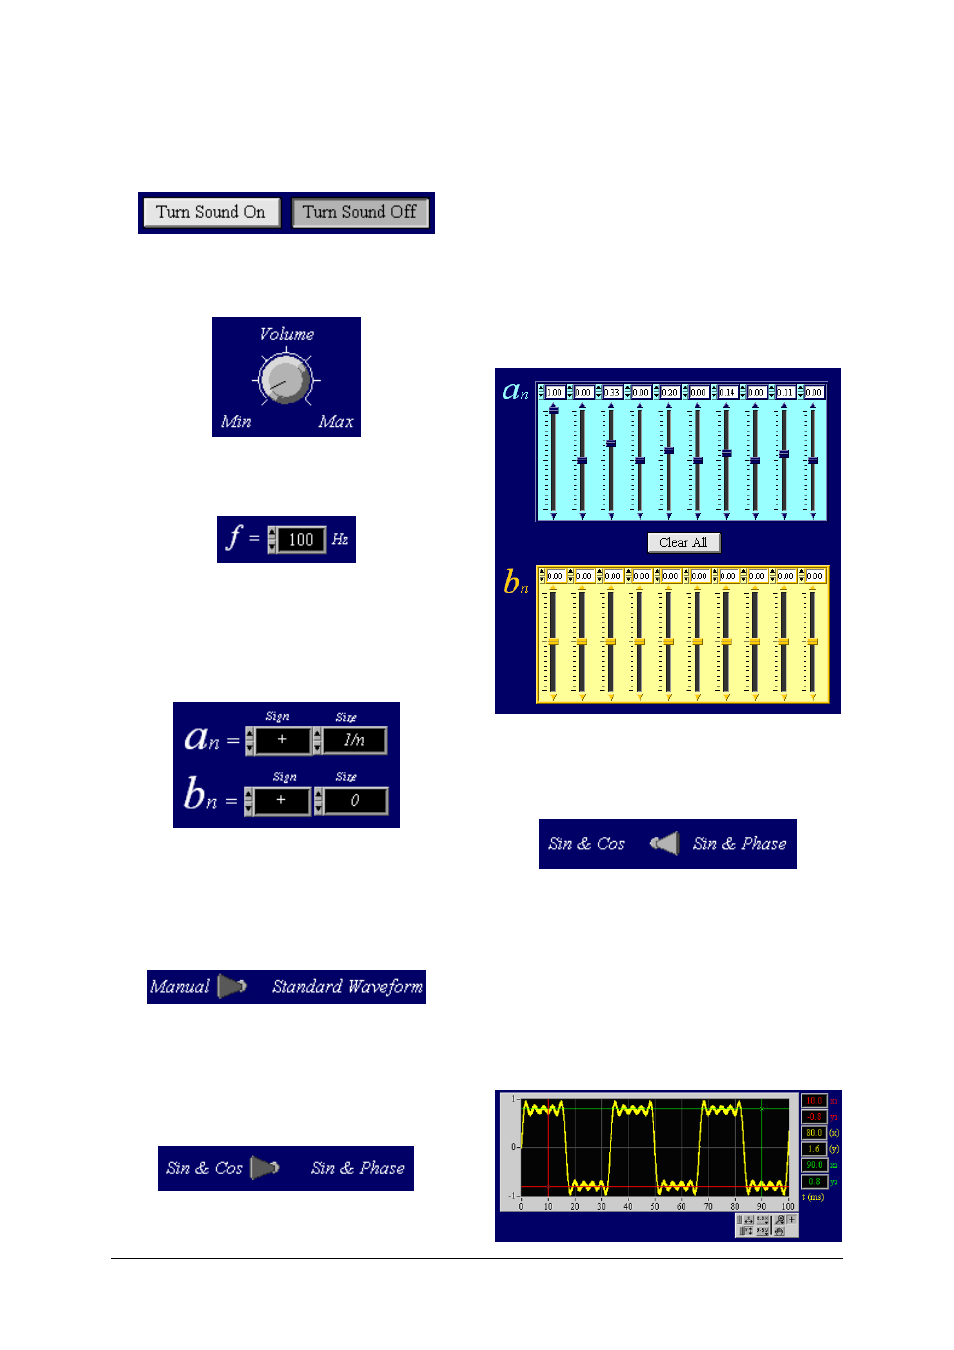
The display below shows what the software displays
when Sines and Cosines are selected. In this case the
synthesized wave was a square wave which uses only
the odd multiples of the fundamental Sine and does
not use Cosines at all (notice all Cosine amplitudes
are set to zero).
Press the “Clear All” button to set all the amplitudes
to zero and start again. The number of sliders shown
depend on the number of components requested in
the black "n =" box at the top of the
Σ.
If Sine and Phase are selected instead, the b coeffi-
cient sliders are replaced by red
Φ (phase) sliders.
3.4 Control of the Graphs
Two graphs are displayed by the program:
the Waveform (yellow) and the Spectrum (blue). A
typical synthetic square wave is shown below:
Notice the palette at the bottom right hand side of
the graph. This can be used extensively to control
various features of the graphs that are plotted.