Wave height, wave period, and wave direction, Viewing fishing information, Surface pressure and water temperature data – Garmin GPSMAP 8530 Black Box User Manual
Page 27: Forecasting fish locations, Visibility information, Viewing buoy reports, Viewing local weather information near a buoy, Creating a waypoint on a weather chart, Weather overlay
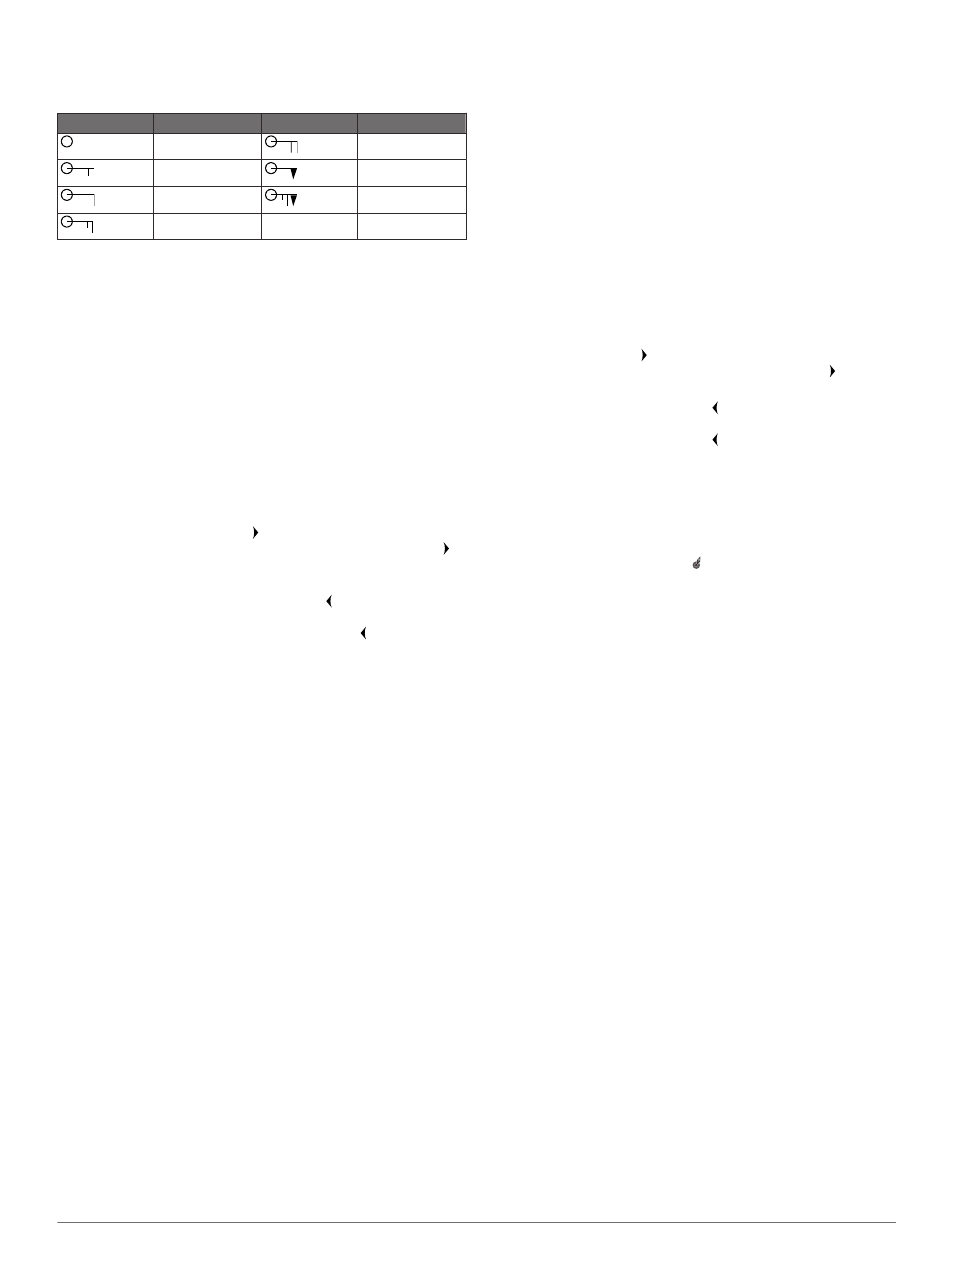
attached to the tail of the wind barb indicates the wind speed. A
short line represents 5 knots, a long line represents 10 knots,
and triangle represents 50 knots.
Wind Barb
Wind Speed
Wind Barb
Wind Speed
Calm
20 knots
5 knots
50 knots
10 knots
65 knots
15 knots
Wave Height, Wave Period, and Wave Direction
Wave heights for an area appear as variations in color. Different
colors indicate different wave heights, as shown in the legend.
The wave period indicates the time (in seconds) between
successive waves. Wave period lines indicate areas that have
the same wave period.
Wave directions appear on the chart using red arrows. The
direction of each arrow pointer indicates the direction in which a
wave is moving.
Viewing Forecast Sea Conditions Information for
Another Time Period
1
Select Weather > Menu > Weather Menu > Change
Weather > Sea Conditions.
2
Select an option:
• To view forecasted sea conditions for the next 12 hours,
select Next Forecast or , and to view forecasts up to 48
hours, in 12-hour increments, select Next Forecast or
again.
• To view the forecasted sea conditions for the previous 12
hours, select Previous Forecast or , and to view
previous forecasts, up to 48 hours ago, in 12-hour
increments, select Previous Forecast or again.
Viewing Fishing Information
The weather Fishing chart shows present water temperature,
present surface pressure conditions, and fishing forecasts.
Select Weather > Menu > Weather Menu > Change
Weather > Fishing.
Surface Pressure and Water Temperature Data
Surface-pressure information appears as pressure isobars and
pressure centers. Isobars connect points of equal pressure.
Pressure readings can help to determine weather and wind
conditions. High-pressure areas are generally associated with
fair weather. Low-pressure areas are generally associated with
clouds and the chance of precipitation. Isobars packed closely
together show a strong pressure gradient. Strong pressure
gradients are associated with areas of stronger winds.
Pressure units are shown in millibars (mb), inches of Mercury
(inHg), or hectopascals (hPa).
Colored shading indicates the surface temperature of the water,
as shown in the legend in the corner of the display.
Forecasting Fish Locations
You can show areas that contain optimal weather conditions for
specific species of fish.
1
From the weather Fishing chart, select Menu > Weather
Menu > Fish Species.
2
Select a species of fish.
3
Select On.
4
Repeat steps 2 and 3 to show areas with optimal weather
conditions for additional species of fish.
Shaded areas indicate optimal fishing areas. If you have
selected more than one species of fish, you can select a
shaded area to view the fish species that are included in the
shaded area.
Visibility Information
Visibility is the forecast maximum horizontal distance that can
be seen at the surface, as shown in the legend on the left of the
screen. Variations in the visibility shading show the forecast
change in surface visibility.
Select Weather > Menu > Weather Menu > Change Weather
> Visibility.
Viewing Forecast Visibility Information for Another
Time Period
1
Select Weather > Menu > Weather Menu > Change
Weather > Visibility.
2
Select an option:
• To view the visibility forecast for the next 12 hours, select
Next Forecast or , and to view forecasts up to 48 hours,
in 12-hour increments, select Next Forecast or again.
• To view the visibility forecast for the previous 12 hours,
select Previous Forecast or , and to view previous
forecasts, up to 48 hours ago, in 12-hour increments,
select Previous Forecast or again.
Viewing Buoy Reports
Report readings are taken from buoys and coastal observation
stations. These readings are used to determine air temperature,
dew point, water temperature, tide, wave height and period,
wind direction and speed, visibility, and barometric pressure.
1
From a weather chart, select .
2
Select Buoy.
Viewing Local Weather Information near a Buoy
You can select an area near a buoy to view forecast
information.
1
From a weather chart, select a location on the chart.
2
Select Local Weather.
3
Select an option:
• To view present weather conditions from a local weather
service, select Current Conditions.
• To view a local weather forecast, select Forecast.
• To view surface wind and barometric pressure
information, select Sea Surface.
• To view wind and wave information, select Marine
Bulletin.
Creating a Waypoint on a Weather Chart
1
From a weather chart, select a location.
2
Select Create Waypoint.
Weather Overlay
The weather overlay superimposes weather and weather-
related information on the Navigation chart, the Fishing chart,
and the Perspective 3D chart view. The Navigation chart and
the Fishing chart can show WX radar, height of cloud tops,
lightning, WX buoys, county warnings, and hurricane warnings.
The Perspective 3D chart view can show WX radar.
Weather overlay settings configured for use on one chart are
not applied to another chart. The weather overlay settings for
each chart must be configured separately.
NOTE: The offshore Fishing chart is available with premium
charts, in some areas.
SiriusXM™
21