Figure 6. spectrogram example – National Instruments NI Spectral Measurements Toolkit User Manual
Page 17
© National Instruments Corporation
17
NI Spectral Measurements Toolkit User Guide
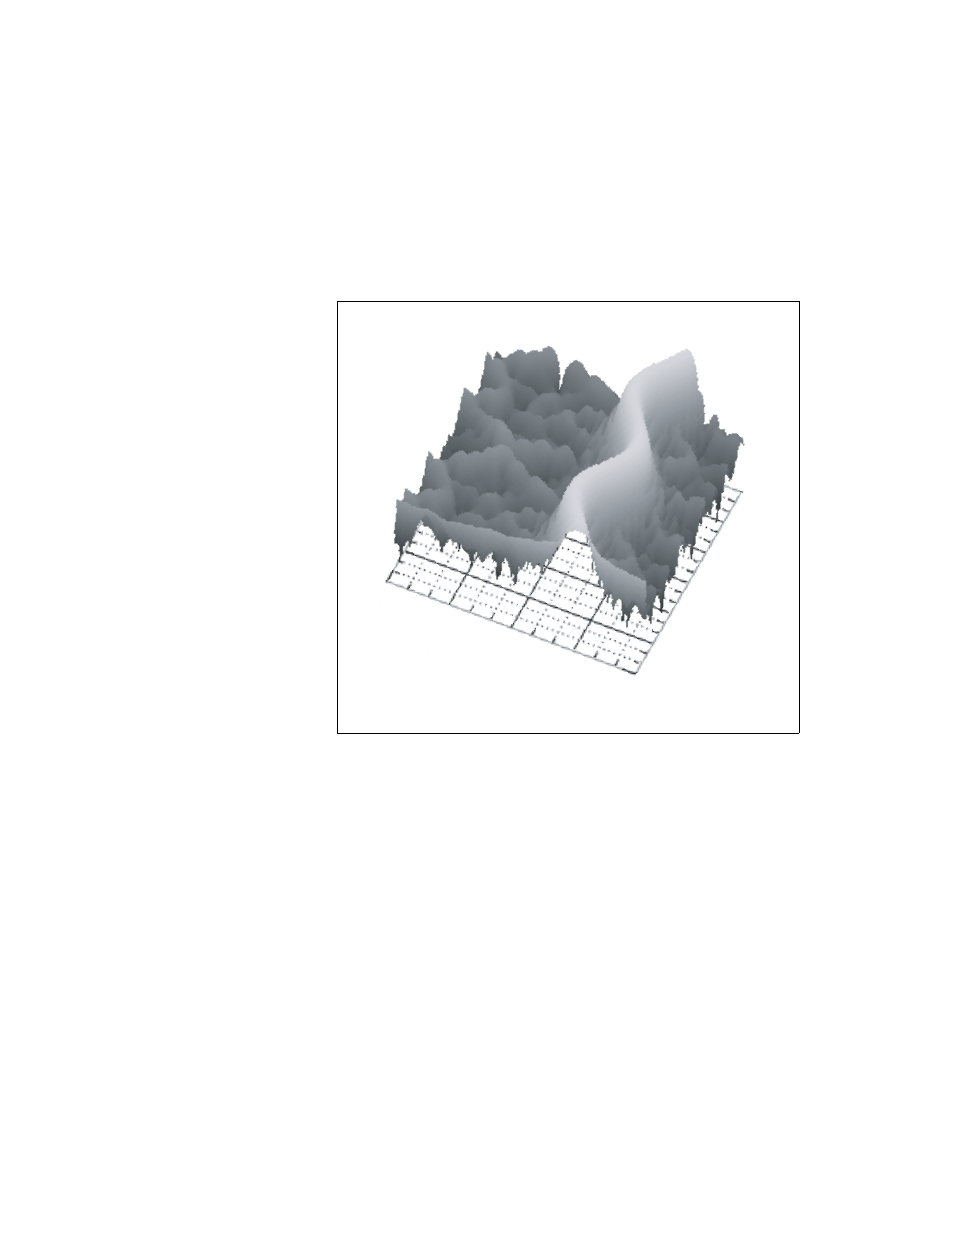
effective band specification. If you leave the default advanced parameters,
the configuration VI calculates the correct parameters for a spectrogram
with evenly distributed time and frequency resolution on a square display
area. If the display area is not square, enter an aspect ratio for the display
area in the aspect ratio parameter. Figure 6 shows an example of a
completed spectrogram with a center frequency of 16 MHz and a span
of 16 MHz.
Figure 6. Spectrogram Example
32 MHz
24 MHz
16 MHz
8 MHz
0 MHz
18
µs
15
µs
12
µs
9 µs
6 µs
3 µs
0 µs