Performance charts – Graco HUSKY 312877C User Manual
Page 21
Performance Charts
312877G
21
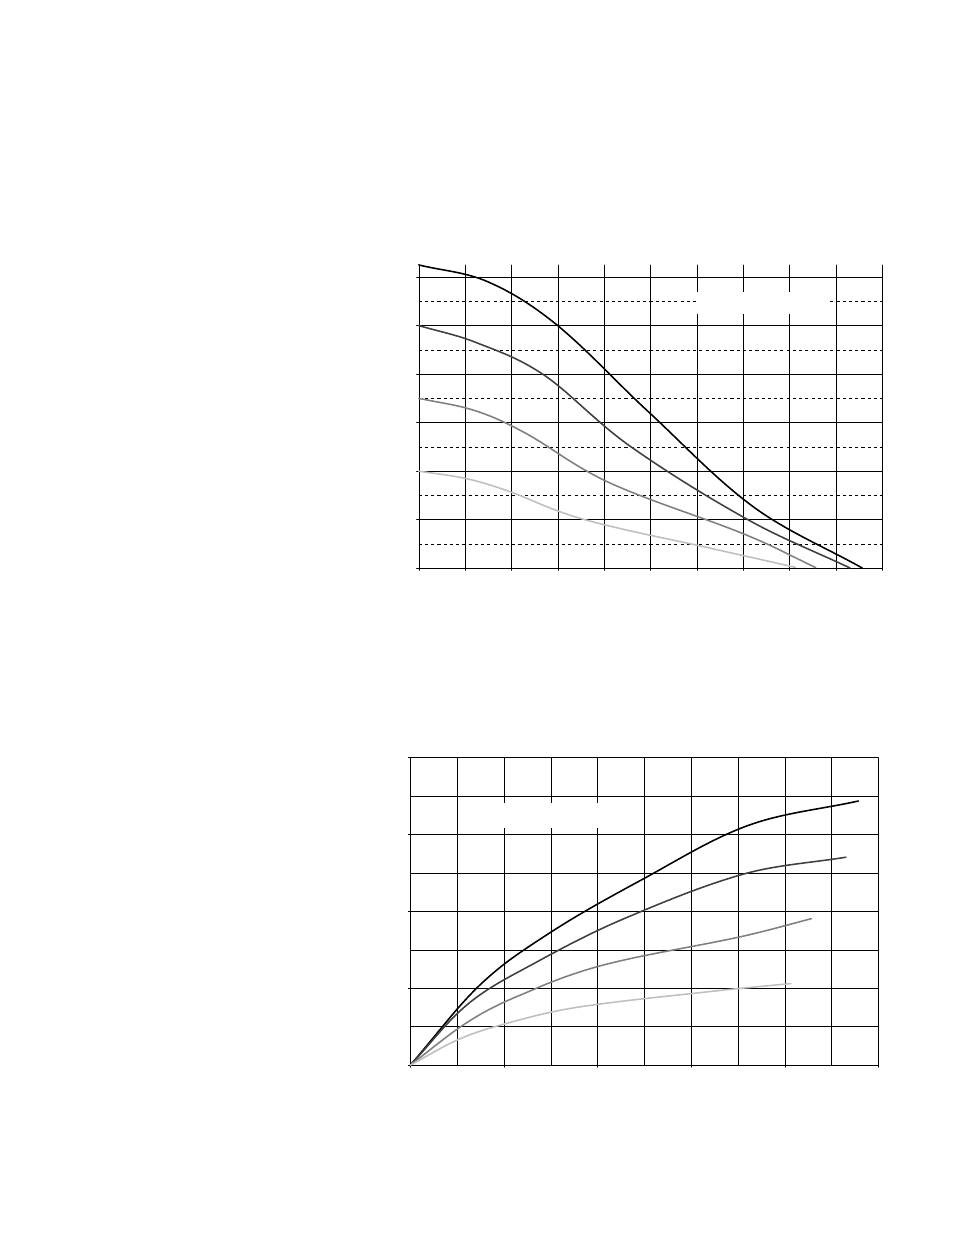
Performance Charts
Test Conditions: Pump tested in water with inlet submerged.
0
5
10
15
20
25
30
35
40
45
50
(19) (38) (57) (76) (95) (114) (133) (152) (170) (189)
A
B
C
D
How to Read the Charts
1. Locate fluid flow rate along
bottom of chart.
2. Follow vertical line up to
intersection with selected
operating air pressure
curve.
3. Follow left to scale to read
fluid outlet pressure
(top chart) or
air consumption
(bottom chart).
0
5
10
15
20
25
30
35
40
45
50
(19) (38) (57) (76) (95) (114) (133) (152) (170) (189)
Fluid Flow — gpm (lpm)
20
40
60
80
(0.56)
(1.12)
(1.68)
(2.24)
A
B
C
D
0
0
20
40
60
80
100
120
(0.14, 1.4)
(0.28, 2.8)
(0.41, 4.1)
(0.55, 5.5)
(0.7, 7.0)
(0.83. 8.3)
Fluid Flow — gpm (lpm)
Air
Con
sumpt
ion
- sc
fm
(c
ubic
met
ers
/min.)
Operating Air Pressure
A
125 psi (0.83 MPa, 8.3 bar)
B
100 psi (0.7 MPa, 7.0 bar)
C
70 psi (0.48 MPa, 4.8 bar)
D
40 psi (0.28 MPa, 2.8 bar)
Fl
ui
d
Pr
es
su
re
- p
si
(M
Pa
, b
ar
)
Fluid Pressure
Air Consumption