Bio-Rad SingleShot™ Cell Lysis RT-qPCR Kits User Manual
Page 7
© 2014 Bio-Rad Laboratories, Inc.
10042477
SingleShot
™
Cell Lysis Kit
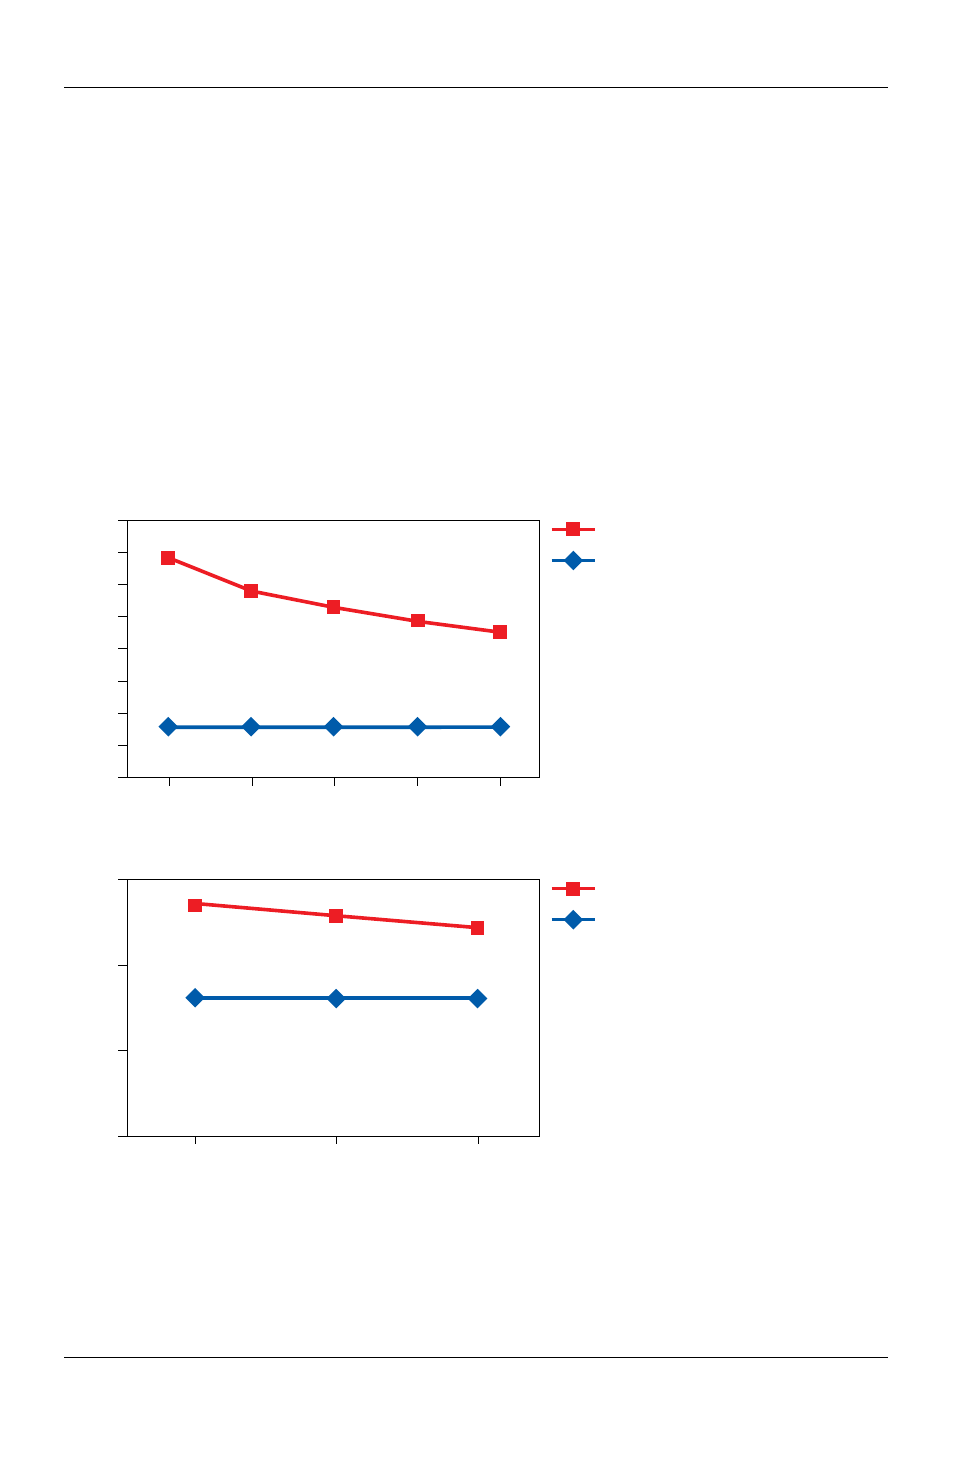
6. Perform data analysis according to the following guidelines:
■
■
RNA control: Plot the Cq values for the RNA control against the percentage input
lysate (Figures 2A and 2B). A constant Cq value across the input lysate range
indicates no RT-qPCR inhibition. A deviation of >1 Cq value indicates RT-qPCR
inhibition. In the example shown in Figure 2A, optimal performance can be
achieved with 100,000–10 input cells
■
■
Target gene: If a target gene is amplified in parallel with the RNA control, plot the
Cq values for the target gene against the percentage input lysate (Figures 2A and
2B). A decrease in Cq value is expected as input lysate increases. Deviation in
the linear response of the RNA control results from incomplete lysis and/or from
RT-qPCR inhibition
A
B
Cq
27
26
25
24
23
22
21
20
19
10
20
30
40
45
Input lysate, %
Target
Control RNA
Fig. 2. Determining optimal input cell lysate amounts. A, the maximum allowable cell lysate input
is 45%. B, this one-step RT-qPCR reaction shows no PCR inhibition across all tested input lysate amounts.
Cq, quantification cycle.
Cq
30
20
10
0
10
15
20
Input lysate, %
Target
Control RNA